
Imminent Yield Curve Inversions?
Around the world, some 10 year-3 month government bond yield spreads are shrinking.
Figure 1 shows ten spreads as of 4/18/2018 and 12/14/2018.
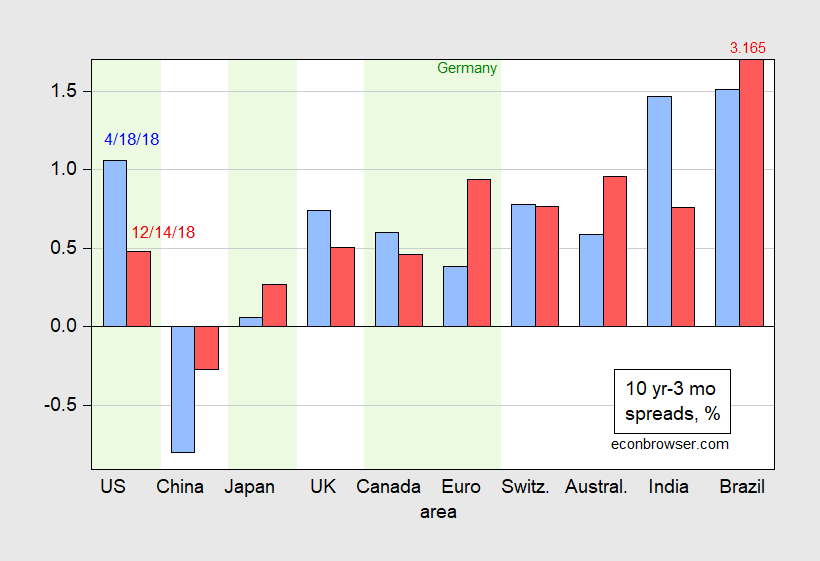
Figure 1: Ten year – three month government bond spreads as of April 18 (blue bar) and as of December 14 (red bar), in percentage points. China three month rate is CHIBOR, Australia is interest rate swap rate, euro area data is for Germany. Light green shading indicates statistical power according to Chinn-Kucko. Source: Economist for April, Bloomberg for December, author’s calculations.
Notice that the predictive power of the yield curve slope for subsequent recessions is not apparent for some countries, and not known for others. Chinn and Kucko (2015) (Table 6) indicates that the yield curve has significant predictive power for the US, Japan, Canada and Germany (and France). No such evidence is found for the UK, so the recent flattening does not clearly imply an imminent recession (inspection of the entire yield curve shows an inversion over the 6 months-3 years maturities).
Mehl (2009) finds that the domestic Indian yield curve predicts Indian economic activity and inflation. In contrast, the US yield curve forecasts Brazilian variables. As for China, which has had an inverted curve for over a year, there’s a dearth of academic work on the subject, but inversions do seem to be associated with industrial production growth slowdowns.
What has been driving spread changes? Figure 2 decomposes the spread changes since April 18th.
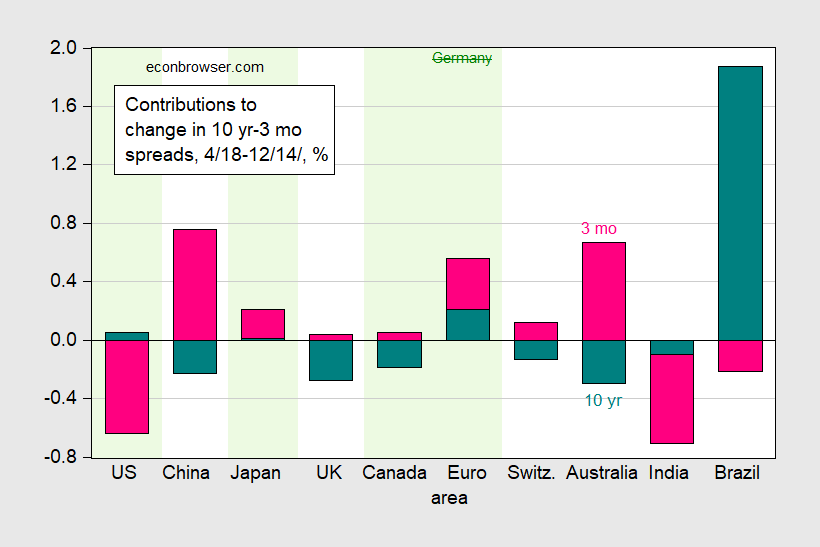
Figure 2: Changes from April 18 to December 14 in ten year – three month government bond spreads arising from ten year rates (teal bar) and from three month rate (pink bar), both in percentage points. China three month rate is CHIBOR, Australia is interest rate swap rate, euro area data is for Germany. Light green shading indicates statistical power according to Chinn-Kucko. Source: Economist for April, Bloomberg for December, author’s calculations.
Only in the US and Indian cases do short rate changes drive down the spread, and even in the US case, long rates have risen — rather than fallen — since April. In the pure expectations hypothesis of the term structure (EHTS), this would suggest higher short rates anticipated for the future; however, the increase could be due to the rebounding of the term premium as quantitative easing is unwound.
Disclosure: None.


