
High-Yield Corporate Bonds ETF In Jeopardy
The High-Yield Corporate Bonds ETF (HYG) is in jeopardy at major resistance.
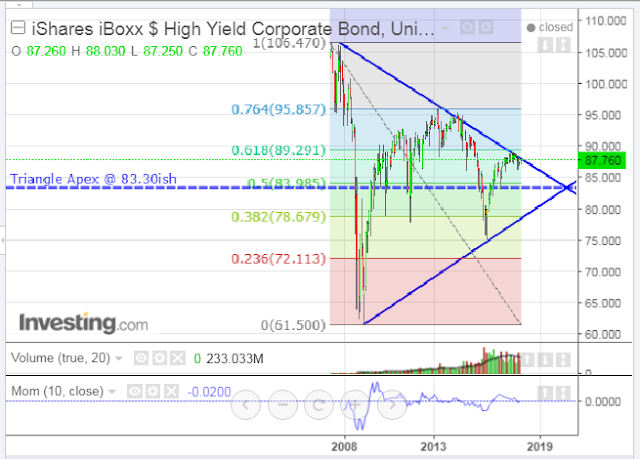
The monthly chart below shows that price is facing double resistance at the confluence of the 60% Fibonacci retracement level at 89.29 and the upper edge of a large triangle formation (both of which began forming during the 2007/08 financial crisis to the 2009 lows).
Major support sits below at the confluence of the 50% Fibonacci retracement level at 83.98 and the triangle apex around 83.30.
The momentum indicator has dropped below the zero level on this timeframe, hinting of more weakness to come, as has been the case, historically.
The next monthly chart shows price action of HYG compared with the S&P 500 Index (SPX). HYG began to diverge from the SPX as far back as April of 2013 and looks like it's getting ready to roll over again. The momentum indicator has recently spiked and is at an all-time high on the SPX.
The gap in price action between these two began to accelerate right after the 2016 Presidential election, and is ever widening as SPX spikes in parabolic fashion. If HYG drops to or falls below its major support around 83.30, we could see some serious selling afflict, not only the SPX, but also other major indices.


