
Has The S&P 500 Run Ahead Of Other Major Market Classes?
The sharp fall in oil prices was the most interesting market news last week. It sends a signal that investors are waking up the fact that the brittle OPEC output deal always was going to be challenged by U.S. producers restarting their drills as prices rose. I am no expert, but this does not come as a surprise to me. OPEC is an unstable alliance, and U.S. producers are governed by one thing and one thing only, price. Whatever detente exists in the global oil market, I am pretty sure that it is a fragile one. A significant leg lower in oil could be significant for a number of reasons. It could herald the speedy end of the "reflation trade," which would suit me well. But if it morphs into something more dramatic, we're back to the story of stress in energy high yield debt, default risks, and perhaps liquidity/fund closure risk in the broader corporate bond market. I am not sure that would suit the portfolio one bit.
The mini-drama in oil probably won't deter the Fed from nudging up rates this week, and economists will remain busy contemplating whether to increase their forecasts for the Fed funds rate. Interest rate futures now price in a good chance of four rate hikes this year. Contrary to the euphoria in equity markets, though, the bond market as a whole has sent a clear message on how to interpret this. The curve has flattened, and I think it will continue to do so. I also think that defensive equity sectors will outperform cyclicals in the next three-to-six months. In short; my views haven't changed that much.
With that point out of the way, let's do some modelling.
What's your target?
Equity strategists are in pickle. The S&P 500 has increased too far too fast in the first few months of the year, exceeding many analysts' year-end targets. This puts the Street's eggheads in a quandary. If they stick to their targets, they have to assume that the market will fall into year-end from here. Clients usually don't take nicely to this, though, and many have been forced to go on TV announcing that they are bumping their targets higher. This is relatively simple stuff; assume an increase in earnings growth and a higher multiple, and it isn't that difficult to find another 5%-to-10% on the index value.
Is that justified, though?
I have no interest in building a "me-too" bottom-up valuation model for the S&P 500 to verify the street's estimate, and I am not going to wade into the murky forests of long-term valuations either. What's left to ask then is whether the rally in S& P 500 is justified based on the movement in other asset classes. In short; what does an arbitrage pricing model have to say? In standard finance theory, the APT framework is presented as an extension to the CAPM, and is based on this 1976 paper by Stephen Ross. The intuition is the same; we are trying come up with a measure of expected return for our asset in question, but the APT model is more flexible.
In a CAPM world we choose between two securities by estimating their beta relative to the market and then look at their expected return based on that beta, and compare with the current realized return. We sell the security that is "expensive" based on the CAPM and buy the "cheap" one. I am not sure that this form of "arbitrage" is actually used by many in the real world. I like to think, though, that credit PMs still run curve arbitrage models in their specific sectors. Think something like a cubic spline model which models a yield curve, and instructs you to buy PG's 2035 paper versus its short-term 2018 paper.
In the core APT model, though, we price our asset as a linear combination of factors/indices and then check whether the realized return, or the value, matches what we see in the real world. The choice, however, of factors and indices is, in practice at least, up to us. OLS is the easiest way to estimate these models, but I am open to other ways of fitting the data. My APT model is a time series model and as a result, we have to model returns. If you're modelling levels in a time series format, you are doing single-variable models and you're checking for cointegration. That's fine, but it isn't what I want to do here. Remember rule number one of time series analysis; always de-trend your data.
In the models below I initially ran my models with U.S. 10y bond futures, gold, DXY, the CRB commodities index, and the HYG ETF, and used step-wise elimination to get rid of variables that weren't statistically significant.
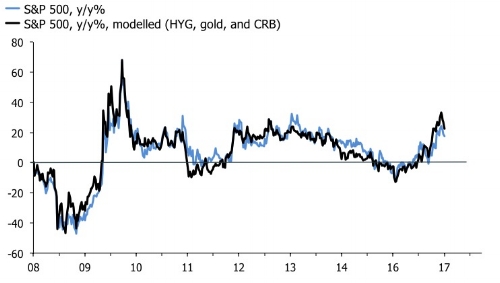
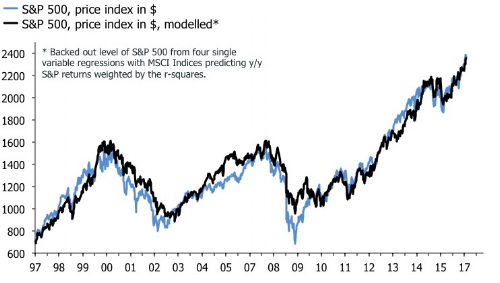
The first chart below shows a model, which takes the data as far back as I can go. It models the year-over-year returns of the S&P 500 as a function of the returns of U.S. 10y bond futures, gold, the CRB commodity index and DXY. The second chart narrows the sample size significantly via the inclusion of HYG—its series only stretches back to 2007—and models S&P 500 returns via HYG, CRB and gold [1].
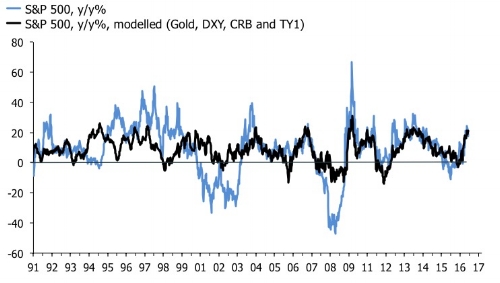
In the first model, it is interesting to note that the accuracy of the model is unstable over time. Luckily, it seems to be better in the last 10-to-15 years compared with the pretty useless fit in the 1990's. We should not be surprised by this. One of the key sources of error in these types of models is that the betas are unstable over time. This is to say, that the rolling betas, or correlations, themselves are functions of regime changes in the market and economy. We could correct for that by checking, and correcting, for structural breaks and to run staggered models to check historical "out of sample" performance. If we can capture the error terms of such models we could pin down any systematic errors.
For practical purposes, though, we shouldn't worry that much about this as long as we retrain the model often enough. This is to say; we are interested in the most accurate relationship between the S&P 500 and other global assets at any point in time, not whether the betas are positive or negative; we should have no priors in this game.
The second interesting point is that these models do not suggest that the S&P 500 is currently out of whack compared to other asset classes. Indeed, both the long-sample model and the sample-constrained model with HYG suggest that S&P 500 currently is underperforming compared with other assets. I would expect this story would change rapidly, though, if general commodity indices and high yield credit were hit by lower oil prices in the next few weeks.
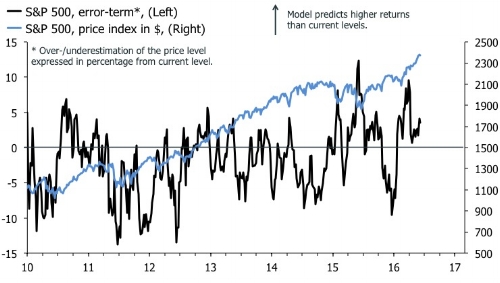
To paint a clearer picture, the first chart below shows the implied price of the S&P 500 based on the modeled returns, and the second shows the error term. The model currently suggests the index should be trading at 2460, which implies a 3.5% "upside" compared to the open on March 10th. This forecast error, however, does not look extreme. It was high, based on this sample, in December, which would have alerted investors to the Q1 rally, but at the moment it isn't sending a signal of any huge price misalignment.
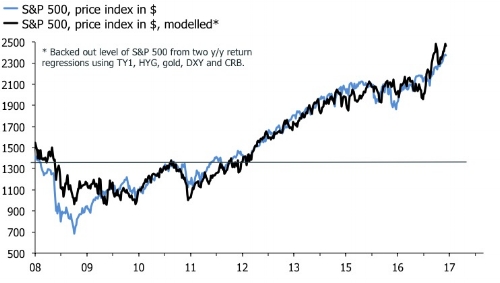
The exclusion of the 2008 period in the second chart is deliberate to not offset the scales. Mean-reversion models don't work well in the context of Lehman-type crises. That will disappoint many. But just remember how well the people predicting recessions and grueling downturns since 2011 have done. Alternatively, this model would have advised you to start buying equities in Q4 2008, which would have been painful for a while, but ultimately profitable.
To cap this little tour of global arbitrage pricing theory I have also valued the S&P 500 using other MSCI equity indices. The intuition here is that you would want to be over- or underweight the S&P 500 relative to other equity markets when the model's error term is at extremes. The first chart shows the prediction of the level, and the second shows the error term with a similar time-frame as in the above chart.
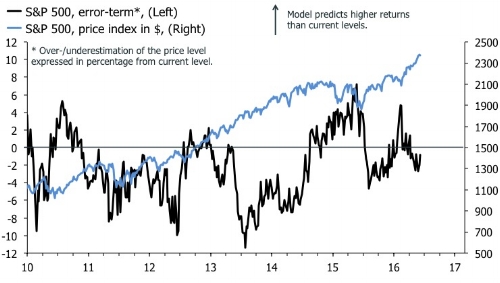
Contrary to the multi-asset model, this framework actually suggests that the S&P 500 is slightly overvalued, although only by 4%. In addition, the error-correction chart indicates that this model isn't very good at predicting impending declines in the S&P 500. In 2013 for example, the model predicted that the S&P 500 was severely overvalued relative to the rest of the world, but U.S. stocks kept on rising, and it was the model that caught up. By contrast, the model seems better at predicting buying opportunities in the S&P 500 as a function of periods when U.S. stocks are underperforming the other major global indices.
What's the lesson?
Firstly, none of the models above suggest that the S&P 500 currently is significantly over- or undervalued relative to other key asset classes. It will be interesting here to see whether the S&P 500 moves in response to a more severe decline in oil, high yield and cyclicals. You would expect so, but if the sector leadership changes, that isn't given, and this should make for some movement in the multi-asset model above. Secondly, the models above suffer from a number of statistical issues. The betas are unstable over time, and many of the independent variables will be tightly correlated, leading to problems of multicollinearity. In addition, the standard APT framework assumes that the return variables can be explained by linear relationships. It is very likely that non-linear relationships, especially during recessions and rebounds from severe downturns, would be more useful. We could correct for this by taking the squared, or even cubed, transformations of the independent variables, but I fear that would lead to even more severe problems of multicollinearity and heteroscedasticity. Finally, the frequency of returns modeled matters.
One of the main "advantages" of sticking to year-over-year returns is that we avoid seasonality problems, which can generate severe estimate problems; especially if it is persistent over time. I haven't checked how big of a problem this is, but I would be wary modeling anything other than year-over-year returns—using this framework—without cleaning the independent variables for seasonality. Another issue is that the lower the frequency of the returns used, the higher is the probability that what you're really modelling is volatility. If that's the case, you probably need to augment your model with GARCH or some other similar methodology.
It's probably best to leave it here. The exercise above is primarily meant as a way to present an alternative, and often neglected way, to model asset prices. I concede that long-run valuation charts of U.S. equities look ugly, but right now the index does not seem substantially mispriced compared to other assets. That is scant consolidation if everything is overvalued, and many of my valuation models for global equities suggest risks are tilted to the downside in the next three-to-six months. But given that asset correlations have fallen recently, I think it is an interesting conclusion that the S&P 500 is "fairly" valued based on other asset classes.
Back in the real world, I suspect we should be watching oil closely next week. If it dives further, it would ripple into other assets, changing narratives all over the place. The reflation theme would be challenged further, economists would have to readjust their near-term inflation forecasts—which would especially important in the EZ—and high yield credit likely would wobble. All of which could be enough to throw off the hitherto well-oiled machine of global risk asset momentum.
[1] - Interestingly, the significance of U.S. 10y bond returns fall out of this model when I include the high yield credit spreads. This shows how multicollinearity often pops up as a "statistical" issue in these models.


