
Curveball
Let's assume that you think the Fed will raise rates two more times this year, and for the sake of argument three times in 2018. It stands to reason that your forecast for two-year yields at the end of next year has to be about 2.5%-to-3.0%. The argument for this sequence of events seems fairly straightforward. The U.S. economy is growing—albeit not spectacularly—, unemployment is sub-5%, and the FOMC is anxious to put the era of super-loose monetary policy behind it. The key question, though, is what your corresponding forecasts for 5-year and 10-year yields are, because we're closer to a do-or-die moment for bonds and the Fed's "hiking cycle."
I think we're looking at a four-scenario outlook.
1) The parallel flattener - In this scenario, the Fed raises rates about five times in the next 18 months, and two-year yields go north of 2%. The curve flattens, but also performs a parallel shift higher. Crucially, in this scenario 5-year and 10-year yields increase—substantially—but less so than the 2-year yield, which will soar as the Fed pushes ahead. In this scenario, the curve does not invert in the next 18 months, but it will be very flat at the end of it.
2) The Trump steepener - In this scenario the Fed also raises rates five times toward the end of 2018, but the economy improves faster than the Fed can keep up with. Presumably, this could only happen if we observed a serious "catchup effect" in terms of inflation and nominal growth and/or if the White House suddenly delivered on both infrastructure and a bullish—but not protectionist—tax reform. Needless to say that this scenario would be cold steel for bondholders across the curve, but especially for duration bulls.
3) The u-turn - In this scenario the Fed is spooked by the dramatic flattening of the yield curve in response to even a modest hiking cycle. As a result, the FOMC backtracks and shuts down the hiking cycle. Given the silliness being practiced at the BOJ and the ECB, I reckon they could just about get away with this by blaming their foreign colleagues, but let's face it; it wouldn't be a good look for Yellen and company. If this forecast is true, I have to assume that Spoos and Blues will fly high. EDs will soar, and stocks will continue to grind higher on the promise of extended low rates. 5-year and 10-year yields should push higher, and the curve should steepen.
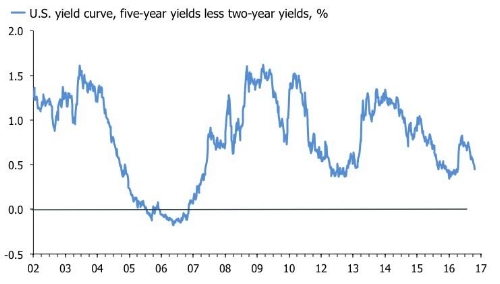
4) The great inversion - In this scenario the Fed pushes ahead, but bond markets won't have it and the curve continues to flatten. It is important to understand here how quick the curve would invert if this is the case. Think about 5-year and 10-year yields, which are now at about 1.7% and 2.1% respectively. If the Fed moves further and the current trend persists, we're looking at an inversion as soon as Q1 next year. The main victim here has to be the stock market. From the perspective of the Fed, this scenario would signal a bold Fed, which is willing to suffer the slings and arrows of an inverted yield curve in order to achieve a good distance between itself and the zero bound.
If the present trend continues, we'll end up in 4, which is certainly possible. But before we get there, we will likely set up a fascinating tug-of-war between scenario 1, 2, and 3. Needless to say, this creates the widest possible range for yields, but the upshot is that we are bound to find out soon what gives. Other people are thinking along the lines of the themes above. Bloomberg's Mark Cudmore recently warned his followers on the terminal that U.S. 10-years soon could trade with a '1' handle. Mark is primarily an FX geek, so he is letting the USD do the talking;
How far can yields decline? The Bloomberg Dollar Spot Index offers some guidance.
Ten-year yields and the index rose in tandem at the end of 2016 as the Trump reflation trade drove markets. Now they’re both retreating, but the dollar index is falling faster, giving up all the gains built after the Nov. 8 election. If yields catch up, the 10-year would be at about 1.8%, a level last seen in early November.
DB's interest rate strategists are on the same bandwagon.
"We think equities continue to move higher and bond yields lower. 10s haven’t yet convincingly broken below 2.15 percent but we stick with the success so far in the excess liquidity-yield momentum model that suggests they will and they ought to move to 2 percent or below. There seems to be a perfect storm of so so growth and falling inflation, enough for the Fed to tighten modestly but being at risk of over doing it."
I am not sure what their "excess liquidity-yield momentum" model contains, but the idea of modestly lower 10-year yields in the short run chimes with my valuation score, which have served me well this year. I also have my eyes keenly fixed on the 2s5s. If it continues to flatten, it would suggest a variant of scenario 4 above. If it doesn't, well then 5-year yields have to rocket soon. If the 2s5s invert, I am selling everything. A final point is that no one, as far as I can tell, is suggesting that we might end up with the "Trump steeepener;" has the bearish bond scenario really now become the contrarian trade? Trusty MM commenter Leftback—who has been a bond bull this year—has a good handle on the long in the U.S., and he is slightly apprehensive.
"That said, 2s30s is at a 9 month low, dollar looks set for a bounce, so wouldn't be surprised to see yields reverse for a bit. We plan to re-examine the technical picture at the weekend and then see what Monday brings (US factory order data…)"

The impending do-or-die moment for bonds presumably also will offer some opportunities in equity markets for bulls and bears alike. Overall conditions remain near perfect for a steady grind higher. Volatility is low and sticky, trailing earnings momentum is decent and the disbelief in the market's ascent remains high. Show me all the positioning charts you want, but this market still overwhelmingly feels like one which is climbing the wall of worry.
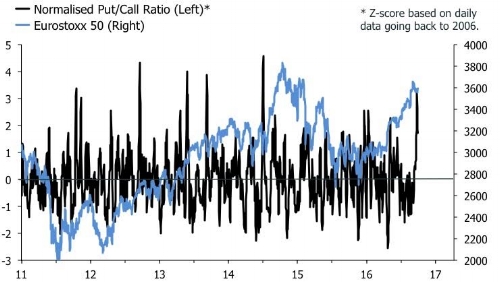
The put/call ratios on the S&P 500 and Eurostoxx provide some evidence that investors remain worried, despite the market's best efforts to lull them into complacency. The first chart below shows that the put/call ratio in the U.S. has ground higher even as the market has pushed ahead. A market hedging on the way up is not a market that is about to crash. The second chart shows the put/call ratio on the Eurostoxx 50; it jumped last week in response to only a marginal setback, which follows a +40% rally since the lows in Q1 16.

The counter arguments to the idea of a slow grind higher currently contains three elements as far as I can see. Firstly, global excess liquidity is rolling, which is a story my old colleagues at Variant Perception have been covering admirably. Narrow money growth has slowed, but inflation and manufacturing output has increased. This suggests "less" liquidity is now available to keep risk assets going higher. It isn't conclusive, though. In the Eurozone for example, excess liquidity is still growing quite strongly, and that will spill over into global asset markets given the euro area's booming current account surplus.
Secondly, many point out the issue of thin leadership in the market. This is effectively the idea that the market is being driven by an increasingly small group of equities. I sympathise with the overall point. It certainly seems that the FANGs are riding high, while a lot of other sectors and themes are struggling. Other indicators of "market internals" also tell an ominous story. Traditional leading cyclical sectors are starting to underperform, which usually leads the index lower, and the weakness in industrial commodities tell a similar story. But other data tell a story of decent breadth on the S&P 500. The chart below shows that net new highs on 52-week basis are well above their long-run average in the U.S. Other indicators might tell a different story, but this doesn't exactly support the idea that FANGs are driving the whole thing. I concede that other measures of market breadth and health will show different things, but this is scant consolation. It only goes to show that these indicators are far from perfect and often point in widely different directions.

Thirdly, economic momentum in China is slowing dangerously which raises the specter of a return to a deflationary impulse to the global economy. The sequence would go something as follows; Chinese growth slows, weakness in commodities price inflation intensifies and the CNY depreciates. In the middle of a mini cyclical upturn, China is a big boost to the global economy, but it stands to reason that when this reverses China quickly reverts to a deflationary impulse. And we know how risk assets are likely to take that. The extent to which China is slowing is difficult to gauge, but the data are starting to roll over.
Meanwhile, I still think the best way to look at equities is to keep a close eye on rotation and divergence between sectors. I concede, though, that it's slim pickings in terms of unearthing "value" here. Healthcare has been a favorite in the portfolio this year—with good result—and I recently beefed up the position in telecoms via an addition to the long in Vodafone. The chart below shows why. The upper left quadrant includes GICS 1 sectors that are cheap based on their own history, and with poor trailing returns. The bottom right shows the opposite.
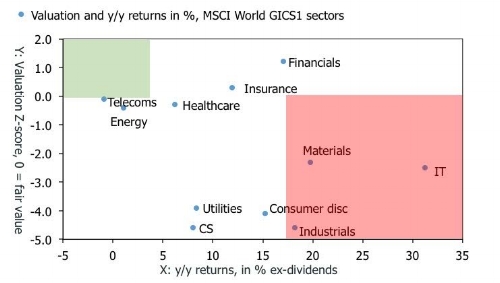
Telecoms and healthcare currently look the least poor based on this framework. In terms of the former ,Vodafone is a major holding of all the big global telecoms ETFs, so if this sector moves into favor, flows will come Vodafone's way. In addition, it is a GBP play, which is useful for me given the poor purchasing power currently being afforded UK investors in the US due to to weak pound.
In healthcare, IXJ US equity has served me well while the two single positions in small-to-mid cap UK healthcare space has been a bit hit and miss. BTG ln equity has held up nicely, but VEC ln equity has been badly punished for uncertainty over its pipeline. It is now, however, very cheap so I am hopeful that I will be get some back-up from the UK value fund managers soon. Energy is starting to look interesting too, but I am not touching these guys. I am not sure where oil is going, but my hunch is that it's heading lower. If that's right, we could also see a transition towards more sustained outperformance in materials and industrials, and perhaps even a period of outperformance in the default-stricken and depressed U.S. retail sector.
Elsewhere, the portfolio's U.S. equity strategy has been a bit of a dumpster fire this year. I did well with WFC in the beginning of the year, but SYNT and URBN have been devastatingly awful. In addition, an attempt to short the FTSE 100 met its embarrassing end in May with the position down 25%. Finally, I had to sell CNCO as the company is delisting its ADRs in the U.S. To add insult to injury, I had to do this after a 15% drawdown towards the bottom of the range. All in all, May was a write off for me, despite a fairly big net long position in equities and the MSCI World up 1.7%. Sometimes I guess the market just throws you a curveball. No need to panic, though. If my analysis is right, the jockeying for positions between the four bond market scenarios above will soon be resolved, which should tell us which ways the wind is blowing.
Disclosure: None


