
Commitment Of Traders: Futures, Hedge Fund Positions, More For The Week
Following futures positions of non-commercials are as of September 25, 2018.
10-year note: Currently net short 756.3k, up 71.6k.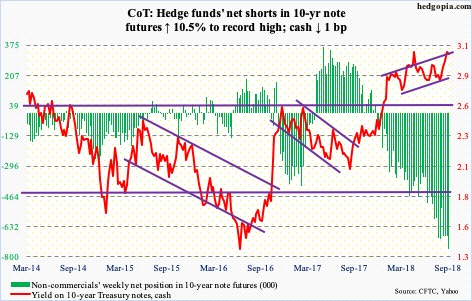
Markets versus the Fed.
Odds of a collision next year continue to rise. Post-FOMC meeting this week, the dot plot kept its forecast of one more hike this year and three in 2019. There are two more meetings left this year – November (7-8) and December (18-19). In the futures market, a December hike is increasingly being priced in, with 80-percent odds, although they fell six percentage points after this week’s meeting. Next year, markets only expect one 25-basis-point hike.
If the dot plot is right, by the end of next year the fed funds rate will be in a range of 300 and 325 basis points, which historically is not that crazy high, but given where rates were post-financial crisis they would have come a long way. Before the Fed began raising in December 2015, rates were left between zero and 25 basis points for seven long years. This has obviously caused a buildup in leverage, particularly sovereign and corporate. A rise in interest payments will bite.
Then, there is the 10-year Treasury rate (3.06 percent). Fundamentally (due to lesser foreign demand for Treasury securities, rising federal budget deficit, planned reduction in the Fed’s Treasury holdings, etc.), there is a lot to argue for much higher yields on the long end. But the 10-year cannot convincingly get past 3.1 percent. There are bids under these notes (more on this here). If the fed funds rate continues to rise, and two-year T-yields follow, it does not take too long before the yield curve inverts. The spread between the two currently stands at 24 basis points. The Fed is between a rock and a hard place.
30-year bond: Currently net short 103k, up 36k.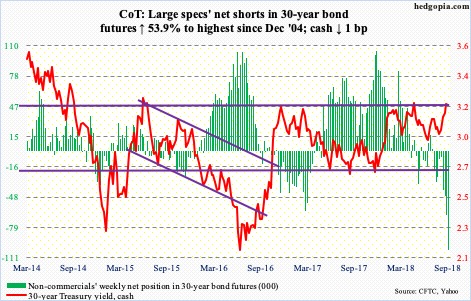
Major economic releases next week are as follows.
The ISM manufacturing index for September comes out Monday. Manufacturing activity increased 3.2 points month-over-month in August to 61.3. This was the highest since 61.4 in May 2004.
Wednesday brings September’s ISM non-manufacturing index. Services activity in July rose 2.8 points m/m to 58.5. January’s 59.5 was the highest ever (data only goes back to January 2008).
Revised durable goods data for August is on tap Thursday. The advance report showed orders for non-defense capital goods ex-aircraft – proxy for business capex plans – rose 7.5 percent year-over-year to a seasonally adjusted annual rate of $69.5 billion. July’s $69.8 billion was the highest since the cycle high $70 billion in March 2012.
September’s employment report is due Friday. Non-farm payroll grew 201,000 in August, for a monthly average this year of 207,000. If this pace is maintained for the rest of the year, monthly job creation would have broken a three-year deceleration. In 2017, an average of 182,000 jobs was created each month, versus 195,000 in 2016, 226,000 in 2015 and 250,000 in 2014.
Crude oil: Currently net long 606.6k, up 19.9k.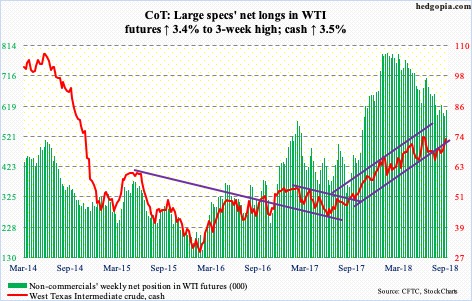
Oil bulls finally took out resistance at $71-plus. Prior to Monday, spot West Texas Intermediate crude ($73.25/barrel) was rejected at that level several times this month. The daily is getting overbought, but bulls near term have a shot at the early-July high of $75.27.
In the week ended September 21, US crude stocks rose 1.9 million barrels to 396 million barrels. Gasoline stocks rose 1.5 million barrels to 235.7 million barrels. Capacity utilization fell five percentage points to 90.4 percent. Crude production increased 100,000 barrels per day to 11.1 million b/d. Crude imports, however, fell 222,000 b/d to 7.8 mb/d. Distillate stocks dropped 2.2 million barrels to 137.9 million barrels.
E-mini S&P 500: Currently net long 197.9k, up 48k.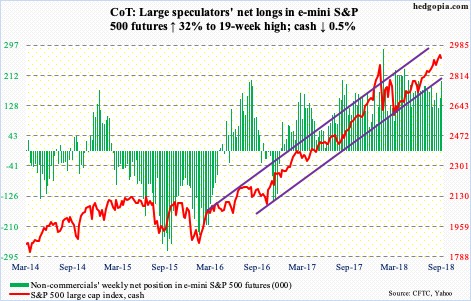
At least from the perspective of flows, bulls put their foot down. In the week to Wednesday, SPY (SPDR S&P 500 ETF) took in $4.5 billion and IVV (iShares core S&P 500 ETF) $204 million, while VOO (Vanguard S&P 500 ETF) lost $1.5 billion (courtesy of ETF.com). In the same week, US-based equity funds (including ETF’s) saw $582 million redeemed (courtesy of Lipper.com).
Last Friday, the cash (2913.98) slightly reversed lower after rising to a new intraday high of 2940.91. This week, action was lackluster to say the least. The last three sessions each produced candles with long upper shadows. Bulls struggled to hang on to the early gains. With October traditionally a volatile month, they would not want to see overbought weekly momentum indicators begin to unwind here. Nearest support lies at 2870s. The 50-day (2868.18) lies right there.
Euro: Currently net long 3.7k, up 2k.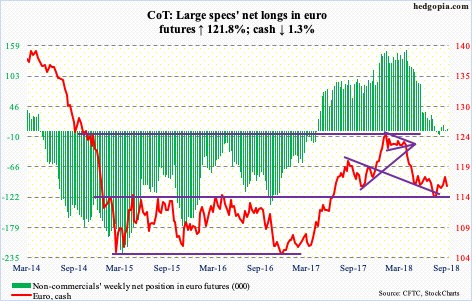
The cash ($116.08) took it on the chin owing to Italian budget woes. Or, traders were simply looking for an excuse to sell. The euro opened the week with a shooting star just north of $118 Monday, followed by another Wednesday. This has been a level where sellers consistently showed up at least the past four months.
Thursday, the euro fell 0.9 percent, and a rising trend line from August 15 when the currency reversed higher after dropping to $113.01 intraday was gone. The 50-day lies at $116.16, and the daily lower Bollinger band (20,2) at $115.33. The latter approximates support at $115-plus, which has proven to be an important level for four years now. It is a must-save.
Gold: Currently net short 17.6k, up 6.8k.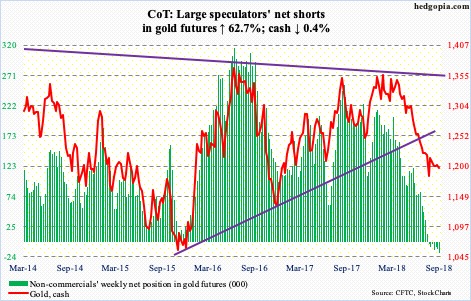
Daily Bollinger bands on the cash ($1,196.20/ounce) have narrowed for over a month before beginning to widen somewhat mid-week. Tighter bands more often than not precede a sharp move. Gold bugs surely hope it is not to the downside. After dropping intraday from $1,369.40 in April to $1,167.10 mid-August, gold has essentially gone sideways for six weeks now – positive if it is a base-building action. At the same time, bulls have been persistently denied at support-turned-resistance at $1,213-ish. Apart from that mid-August low, there is support at $1,180s, which goes back nine years. There were bids at that support Friday.
Positively – if it can be called that – GLD (SPDR gold ETF) in the week through Wednesday did not lose any funds; there was no activity whatsoever. In the prior 21 weeks, the ETF lost $5.1 billion, with only one week of positive flows. Also in the week to Wednesday, IAU (iShares gold trust) gained $44 million (courtesy of ETF.com).
Nasdaq 100 index (mini): Currently net long 36.3k, up 7k.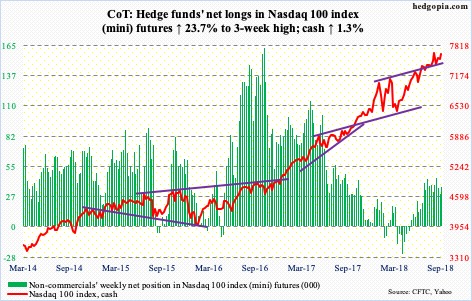
Once again, bulls defended the 50-day on the cash (7627.65). In the week ended Wednesday, QQQ (Invesco QQQ Trust) took in $1.4 billion (courtesy of ETF.com). This month, the average was tested several times – successfully. But the fact remains that the Nasdaq 100 has not been able to lift right off of this support.
This week, the index rallied 1.3 percent, but is still below its all-time high of 7691.10 reached on August 30. Wednesday produced a gravestone doji, followed by back-to-back candles with upper shadows. In a best-case scenario, bulls have a shot at 7750, which is the upper bound of an eight-month ascending channel. Down below, there is support at 7500, 7400 and then 7300.
Russell 2000 mini-index: Currently net short 17.9k, down 18.9k.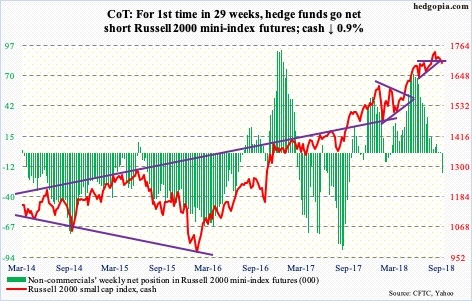
Small-caps continue to lag, and they have done that for a while. The cash (1696.57) had a false breakout five weeks ago, followed by a new all-time high of 1742.09 on August 31. The subsequent decline not only cost the Russell 2000 the breakout level just north of 1700 but also the 50-day.
In the past, shorts lent a big helping hand. That fuel is increasingly drying up. Mid-September, short interest on IWM (iShares Russell 2000 ETF) fell 5.4 percent period-over-period to an eight-and-a-half-month low.
This week’s 0.9–percent drop came despite positive flows into small cap-focused ETF’s. In the week through Wednesday, IWM gained $2.6 billion and IJR (iShares core S&P small-cap ETF) $202 million (courtesy of ETF.com).
The daily chart is getting oversold. In the event of a rally, it is possible shorts appear at the 50-day (1701.76) and at 1710-ish after that.
US Dollar Index: Currently net long 37k, down 447.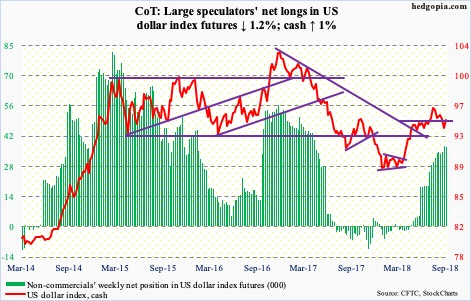
Support at 93.30-ish held. The cash (94.74) dropped intraday from 96.87 on August 15 to 93.39 last Friday. A corrective move should follow of this impulsive decline. A falling trend line from that high was broken Friday. There is room for the US dollar index to rally on the daily chart. The 50-day rests at 94.88, which was tested Friday. There is decent resistance at 95-plus.
VIX: Currently net short 139.8k, up 20k.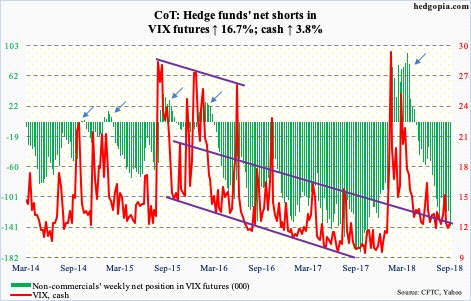
After last Friday’s tagging of the daily lower Bollinger band just north of 11, the cash (12.12) this week tried to rally past the 50-day but was held back. The average is flat, even as the 200-day is ever so slightly rising, with the 11 level providing support the past five months. These are all positives, except rallies struggle to hold. Since the February spike, VIX has persistently made lower highs. It breaks out at 14 – whenever that is.
In the meantime, the 21-day moving average of the CBOE equity-only put-to-call ratio ended the week at 0.599. It has risen since 0.588 on Tuesday. This is a low reading. If the ratio has bottomed, in due course it can rally to high-0.60s to low-0.70s.
Disclaimer: This article is not intended to be, nor shall it be construed as, investment advice. Neither the information nor any opinion expressed here constitutes an offer to buy or sell any ...
more

