
Calling A Bottom In Long Bond Yields
Since the QE3 announcement, equity markets have struggled as we approach the deadline for resolution of the tax cut and benefit extensions decided by Congress (the fiscal cliff). Fiscally, a sudden move toward balancing the budget would almost necessarily be a drag on GDP. The view of optimists is that some sort of compromise can be reached, where the effects of policies to reduce outlays and increase tax revenues can be achieved in a balanced and gradual way to avoid jolting the economy into recession.
From a trader's perspective, I would grow increasingly concerned as the deadline approaches if a deal still appears out of reach. A failure to compromise could result in a very similar scene to the debt ceiling circus of August 2011 -- causing dramatic movements lower in stocks. Either way, we know this:
- The outcome will have an impact on markets.
- It is an event, and probabilistic in nature.
As important as it is to accurately project odds of whether Congress is going to come to some sort of a great deal and what exactly it would entail, I will refrain, and instead focus largely on the country's ongoing monetary policy.
Federal Reserve Balance Sheet And Open Market Operation Results
As instructive as the Fed press releases can be about the general direction they wish to take their balance sheet, it is no substitute for the numbers themselves. Deciding to put Fed opacity to the test, I have been analyzing factors affecting reserve balances and their open market operations. A look at Fed assets and liabilities broken down by category, after cleaning and simplifying the data just a bit:
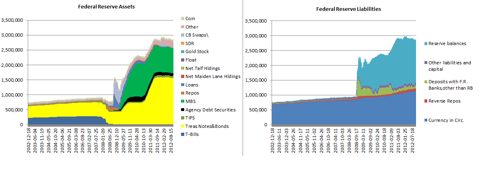
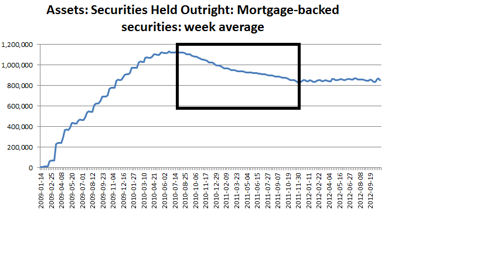
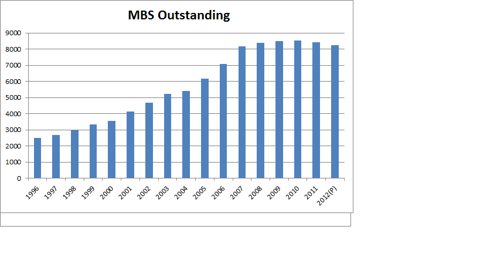
What surprised me about these series was that MBS held by the Federal Reserve have actually been in decline since its peak of ~$1.1T in July 2010. MBS can migrate off of the Fed balance sheet by maturing, being defeased/prepaid, or by being sold. The same conditions apply to the total amount of outstanding MBS market-wide, after replacing "being sold" with "being written-off.
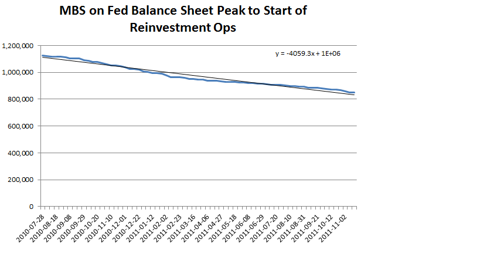
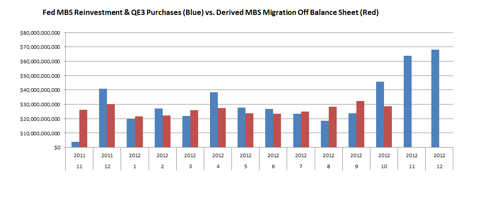
The Fed also announced incremental purchases of ~$40BN MBS in their September 13th QE3 press release. This is added to their re-investment ops related to operation twist, where they have been consistently adding between $25-$30BN in newly issued MBS over the past year. On their website, they make these purchases of government securities public, and I derive an estimate for the rate securities are migrating off the balance sheet with the open marker data in conjunction with the factors affecting reserve balances (organizing purchases by contract settlement date).
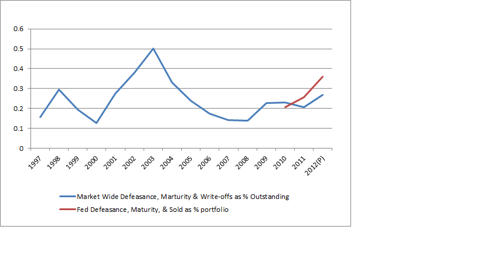
Using the Fed's recent open market data, we are able to get an estimate of the pace the Federal Reserve has actually gotten legacy MBS assets off of their balance sheet in one way or the other. Opacity prevailing, we see that the current pace of turnover is higher than that of the MBS outstanding market as a whole, suggesting that some of their legacy holdings are being sold back to the market rather than maturing or being defeased -- explaining the difference. It would, however, be nice to have a much longer time series to see if this degree of divergence in migration-off rates is simply explained by random chance. The legacy MBS should be lower quality at a loan-level, and should add incremental risk to whomever may be purchasing these MBS, despite the cash flows being federally guaranteed, for now.
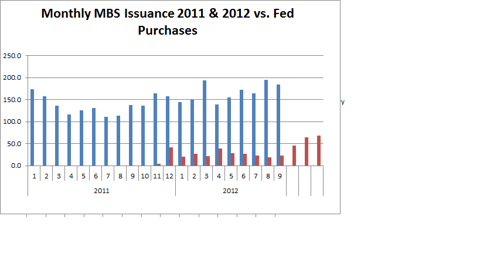
The first two series of "QE3 era" investment ops are included in this data, so we can have a look at how the policy change is affecting markets. At the current pace, the Fed will be buying about 50% of new issuance. The effect on yields has been quite dramatic.
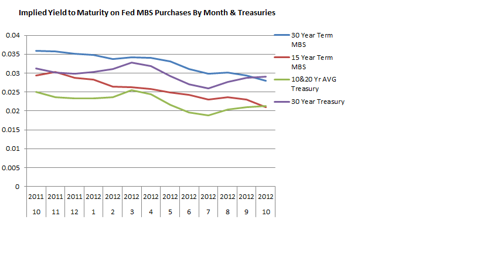
Shown above are yields to maturity for Treasury securities plotted against their agency MBS duration counterparts. These implied MBS yields have actually dropped marginally below the Treasuries of comparable duration. At first blush, this should not be theoretically possible. First and foremost, it illustrates the distortion that the Fed is adding to the MBS market with their policy. Even assuming these purchases are nothing but the most senior tranches of debt, and zero credit risk, these MBS should never be yielding less than Treasury bonds because of the "prepayment risk."
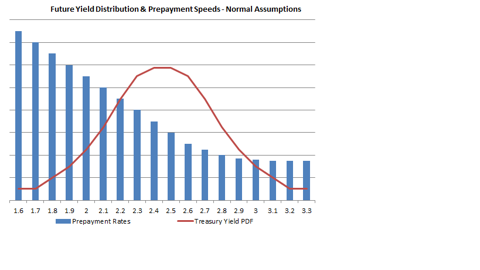
Focusing on this cash flow disruption, there is one obscure argument that could justify this pricing anomaly: Prepayment risk of mortgages and mortgage backed securities is actually a form of risk-off, in that you are returned a higher quality cash flow, normally Treasury bonds, in place of the MBS. Market participants have observed that higher prepayment rates are correlated with lower interest rates, so the asset replacing the MBS will on average have a lower yield, therefore hurting the returns of the entity purchasing the security. The misnomer of prepayment "risk" can apparently be attributed to the majority's goal and view of these products -- as vehicles of returns and not of risk sharing. But I digress. Regardless of that point, cash flows used to replace the MBS upon prepayment will be variable in yield and volume based on future market conditions. An approximately normal shape of these distribution assumptions for any future date is shown below, using a hypothetical current yield of 2.5:
These assumptions are normally correct, but are not truisms necessarily. If the distribution for future expectations of prepayment rates and Treasury yields (which will be used to replace the asset) were skewed enough, you could have a condition where prepayments actually result in collecting an average cash flow that is higher than the MBS. A combination of extreme expectations for (1) rising yields, and (2) non-interest-rate-sensitive prepayments (all mortgage holders pay off early, and nobody refinances) as shown below could achieve this result.
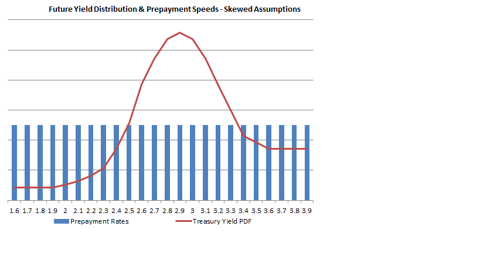
Also important to this assumption is that the Fed's buying pressure keeps senior MBS at virtually no spread to same-duration Treasuries. But using the distributions shown above, we have an average prepayment replacement yield of 2.43 in the normal example, and one of 2.96 for the extremely skewed scenario.
Apparently, it is not just the Fed participating under these skewed assumptions. Again, using the Fed open market data, we see information for some MBS sales, the result of their dollar roll operations. Dollar roll/coupon swap explanation is once provided by the Fed through their website:
The Desk may use dollar roll and coupon swap transactions if needed to facilitate settlement associated with its unsettled agency MBS purchases. A dollar roll is a transaction that generally involves the purchase or sale of agency MBS for delivery in the current month, with the simultaneous agreement to sell or purchase substantially similar (although not necessarily the same) securities on a specified future date. A coupon swap is a transaction that involves the sale of one agency MBS and the simultaneous purchase of another agency MBS, each with different coupons.
Reminiscent of Long Term Capital Management, the Fed looks to substitute securities that are practically the same for all intents and purposes, but help in facilitating settlement, alternatively phrased -- opportunistically looking for absences in liquidity and more favorable from a price perspective. Long Term Capital Management used, what effectively sounds like the same strategy back in the 90s very effectively at extremely high leverage, trading long-term government bonds (this technique was not their undoing). To assess how the Fed is following in the footsteps of Sholes and Merton, I use two comparisons of roll operations to try to get near apples-to-apples: prices by CUSIP, and prices by roll date. The Fed has purchased at a lower price for 27 of 28 of their rolls involving the same CUSIP, and at 23 of 25 of rolls on the same date. They are executing these roll operations very well -- buying low and selling high -- and it illustrates that it is not only the Fed who is still buying MBS under warped assumptions.
This brings me to my call -- the bottom in Treasury yields. Despite the buying pressure the Fed will continue to provide in the long bond market, I think that the anomalous MBS prices show a general expectation for rising yields. This expectation for rising yields could be based on reduced external buying, a gradual shift away from USD denominated bonds' use in "risk-off," and inflation compensation over the long term.
Fed Exit Strategy And Changes In Policy
Given the expansion of the monetary base, it remains an open-ended question of how and when the Federal Reserve plans on taking away the "punch bowl," and how to ensure that these excess reserves remain sterilized. By sterilized, I mean impacting only base money (Fed assets/liabilities), and not the money supply (M1, M2, MZM). There has been some debate among very knowledgeable market observers (examples here and here) on the impact of interest on excess reserves. The remuneration rate is currently set at 0.25%. The argument for paying a rate on these deposits is that it should at least offset the cost of servicing them, and any rate above the cost of servicing will be expansionary to the banks' ability to lend moving forward. A penalty rate -- that is, any rate below the cost to service these deposits -- would motivate lending because the banks would rather lend the money than let it sit idly.
I believe a penalty (negative remuneration) rate would indeed motivate lending, but is not prudent, as it would encourage banks to lend against negative expectations. On the other hand, I think that a remuneration rate above the cost to service deposits is only pro-lending if the required reserves are the factor limiting the banks' choice of whether or not to lend, as opposed to credit worthiness and credit demand of their customers. Based on the recent dynamics of credit, demand deposit, and currency growth, it does not appear to me that the reserve requirement is really the limiting factor in U.S. banks' lending practices. Therefore, I do not think a negative remuneration rate is as contractionary as Stella suggests, but also would not necessarily feel compelled to lower the rate for fear of unintended consequences in loan-level risk taking.
If the Fed remains actively increasing its own balance sheet duration, it will be adding negative pressure to long bond yields and therefore, mortgage rates. I believe that the main indicators the Fed will be watching to determine their future policy will be real estate prices and sales volumes. Low mortgage rates will be an important factor for both of these indicators. So I expect the Fed to keep spreads on MBS extremely tight (or negative) and to continue to buy long on the yield curve until prices and volumes rise. When real estate prices do rise significantly, I believe the Fed will begin to unwind its balance sheet, let rates rise further, and let animal spirits in the housing market take control and lead home prices higher. Whatever their "escape velocity" assumptions are for real estate, I am unsure, but my feeling is that they probably are thinking about their own reversal of strategy in this context. For this reason, I expect the bottom of yields to be very gradual, but ultimately in place.
Conclusion And Investment Implications
Based on MBS implied yields of Federal Reserve purchases, I expect that longer-maturity Treasury yields are at or very near their bottom. I also expect that the continued buying pressure from the Fed will make movements off of this bottom very gradual. It appears that the MBS market is extremely distorted due to the Fed's participation, and this distortion makes for a difficult environment for REITs to operate with any sort of good risk-adjusted margin. I would generally avoid buying any REITs, examples including: American Capital Agency Corp. (NASDAQ:AGNC), Anworth Asset Mortgage Corporation (NYSE:ANH), Capstead Mortgage Corporation (NYSE:CMO), Hatteras Financial Corp. (NYSE:HTS), and Annaly Capital Management (NYSE:NLY) .
Because of the loose monetary policy, continued open market operations, rising money supply, and positive global GDP growth, I would continue to selectively buy companies with exposure to hard assets and energy. A list of companies I would consider buying include: Stillwater Mining (NYSE:SWC), North American Palladium (NYSEMKT:PAL), Allegheny Technologies Incorporated (NYSE:ATI), Aluminum Corporation of China Ltd (NYSE:ACH), Mitcham Industries (NASDAQ:MIND), Arch Coal (ACI), Peabody Energy (BTU), Alpha Natural Resources (ANR), BP (NYSE:BP), and Exxon Mobil (NYSE:XOM). I expect the dollar's long-term trend to remain negative and for real estate prices to continue higher.
Disclosure: I am long BTU, ANR via call options. I wrote this article myself, and it expresses my own opinions. I am not receiving compensation for it and I have no business relationship with any ...
more

