
“Breakout” – Let’s Try This Again

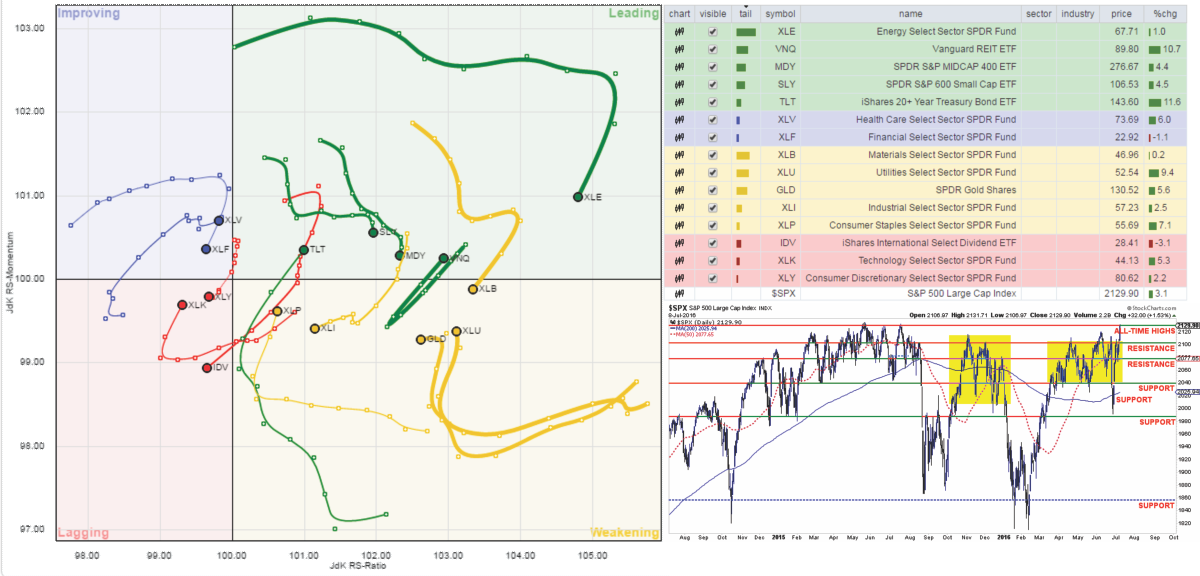
Here we go again. Another Friday. Another attempted breakout above the 2100 level on the S&P 500. Over the last couple of months, as shown below, this has become a regular occurrence.

While the market is once again extremely overbought on a weekly basis, the employment report on Friday which showed a historically abnormal surge in June jobs growth, despite a weaker than expected wage increase and further negative revisions to May’s report, sent investors scrambling into the market. That push on Friday was enough to trigger a short-term buy signal and set the market up for a push to all-time highs.
However, don’t get too excited just yet. There are several things that need to happen before you going jumping head first into the pool.
- We have seen repeated breakout attempts on Friday’s previously which have failed to hold into the next week. Therefore, IF this breakout is going to succeed, allowing us to potentially increase equity allocation risk, it must hold through next Friday.
- The overbought condition on a weekly basis needs to be resolved somewhat to allow enough buying power to push stocks above 2135 with some voracity. A failure at that resistance level could lead to a bigger retracement back into previous trading range of 2040-2100.
- Interest rates, as shown below, need to start “buying the rally” showing a shift from“safety” back into “risk” as seen following the April deviation. (Gold bars show declining rates correlated with falling asset prices. Green bars are rising rates correlated rising assets.)
- Volume needs to start expanding, second chart below, to confirm “conviction“ to a continuation of the “bull market.”


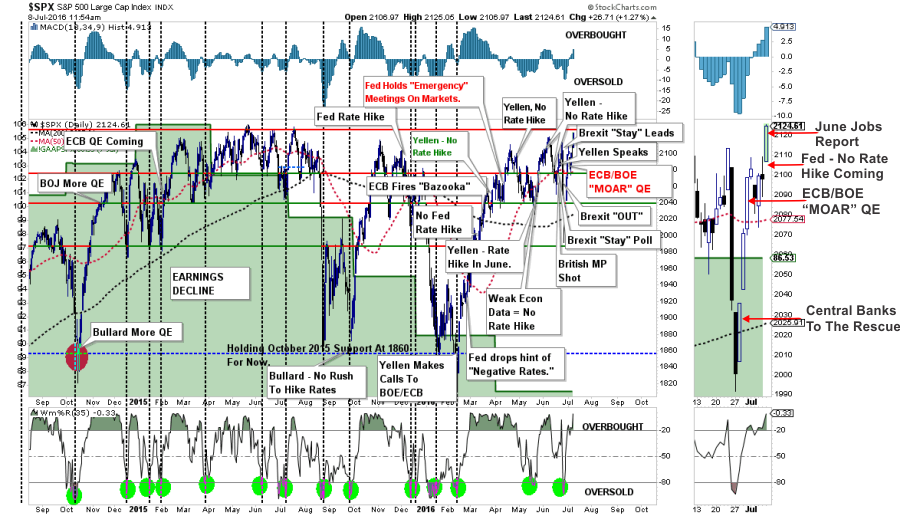
It is important to note, as shown in the chart above, that recent short-term “sell-signals” have been reversed temporarily. However, these are very short-term signals in nature and can be quickly reversed so caution is advised at getting overly excited at the moment.
As shown below, while the market is trying to breakout above 2100, it is doing so with the market, as stated above, extremely overbought and within the context of a negative divergence from longer-term price trends. As shown, these negative divergences have tended to be resolved, although they can take time, with a market correction. Support levels current reside at 2080, 2040, 2030 and 1990.
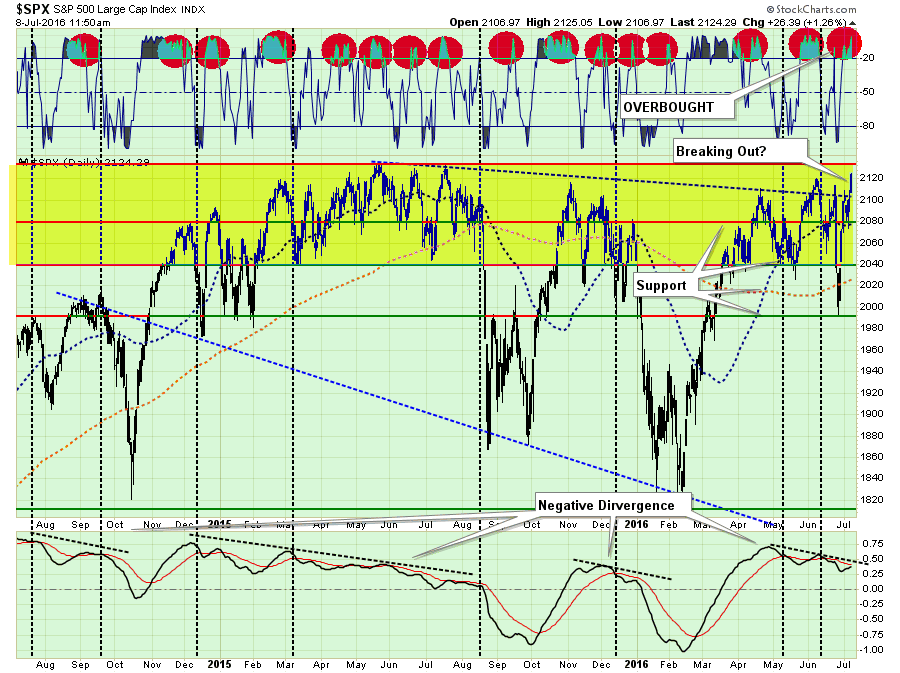
Importantly, this is not a “bearish” outlook, but rather one that simply suggests caution before adding to current levels of portfolio risk.
As shown in the chart below, the market has continued to vacillate between one event to the next. From central bankers to job reports, the markets have not been trading on fundamentals but whether or not there will be more support from global Central Bankers.The interesting thing about the jobs report on Friday is that it removes another excuse from the Fed NOT to hike rates in July. They won’t, of course, but according to their own data they should.
Just as a side note, the BLS publishes an adjusted employment number which more accurately reflects what is happening in the real economy. To wit from the BLS:
“For research and comparison purposes, BLS creates an ‘adjusted’ household survey employment series that is more similar in concept and definition to payroll survey employment. The adjusted household survey employment series is calculated by subtracting from total employment agriculture and related employment, the unincorporated self-employed, unpaid family and private household workers, and workers absent without pay from their jobs, and then adding nonagricultural wage and salary multiple jobholders. The resulting series is then seasonally adjusted. The adjusted household survey employment tracks much more closely with the payroll survey measure; nonetheless, occasional trend divergences occur.”
This measure of employment actually DECLINED by 119,000 in June.
As noted by David Rosenberg:
“What if I told you that employment actually declined 119,000 in June and has been faltering now for three months in a row? Yes, that is indeed the case.
It’s not as if the Household sector ratified the seemingly encouraging news contained in the payroll data as this survey showed a tepid 67,000 job gain last month and rather ominously, in fact, has completely stagnated since February.
Historians will tell you that at turning points in the economy, it is the Household survey that tends to get the story right.
The simple fact of the matter is that May and June were massive statistical anomalies. The broad trends tell the tale. Go back to June 2014 and the six-month trend in payrolls is running at a 2.2% annual rate and the three-month trend at 2.4%. A year ago, as of June 2015, the six-month pace was 1.9% and the three-month at 2.2%. Fast forward to today, and the six-month annualized rate is 1.4% and the three-month has slowed all the way down to a 1.2%. This is otherwise known as looking at the big picture.
When the Household survey is put on the same comparable footing as the payroll series (the payroll and population-concept adjusted number), employment fell 119,000 in June — again calling into question the veracity of the actual payroll report — and is down 517,000 through this span. The six-month trend has dipped below the zero-line and this has happened but two other times during this seven-year expansion.”
The chart below enhances David’s work by comparing the 6-month annual percentage change of the adjusted employment index as compared to the official payroll measure, the civilian household measure, and the Fed’s Labor Market Conditions Index. Importantly, on a trend basis, all measures have turned lower.

In other words, don’t put on the “party hats” just yet.
FEAR, NO FEAR
Complacency is back. A week ago, the world was awash in digital ink about how the “Brexit” spelled the demise of the world as we know it. As I stated two weeks ago, this was likely NOT to be the case. Now, the markets are acting as if “Brexit” never existed and fears of a market correction have evaporated.

It is worth noting, however, outside of the two exceptions where Central Banks were fully engaged in liquefying markets, when volatility levels have fallen below 15 it has normally coincided with short and intermediate-term market tops.
Does this mean the market will “crash” next week? Of course, not. However, it does suggest that the recent push higher is likely to “run out of gas” in fairly short order.
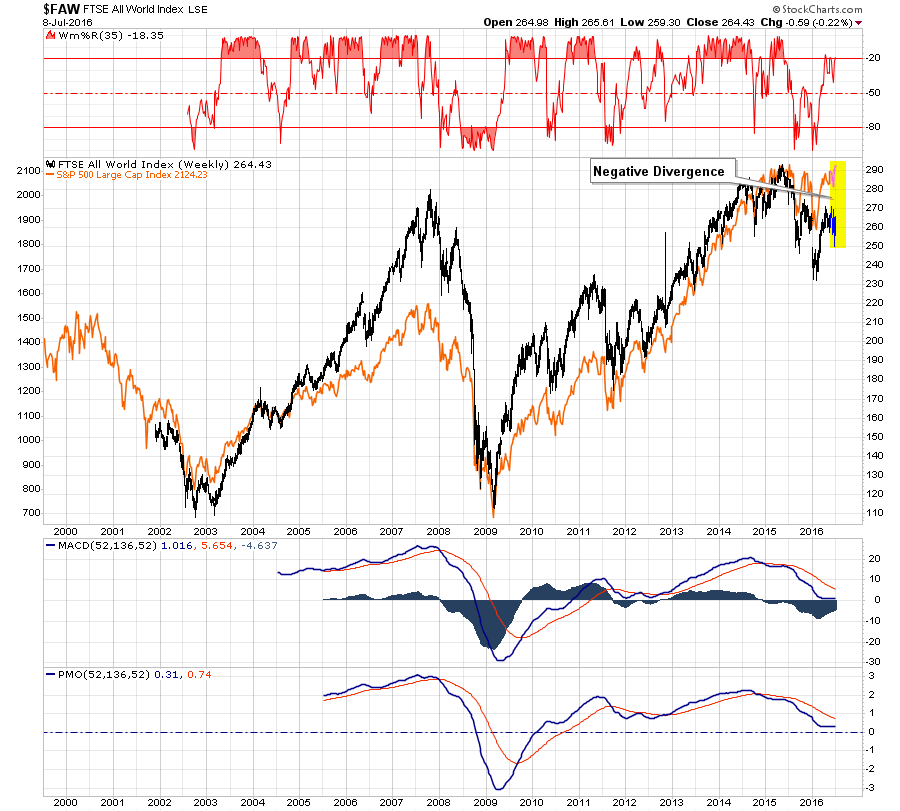
INTERNATIONAL DIVERGENCE
One other interesting point is the current divergence between international and domestic markets. With money fleeing Europe into the “safety” of U.S. denominated assets, the divergence between asset prices, interest rates (noted above) and international markets is not typical. The negative divergence currently being witnessed will likely not last long and either international markets will begin to garner traction or domestic asset prices will revert.
The same negative divergence is also witnessed between the S&P 500 and MSCI International and Emerging Markets indices.
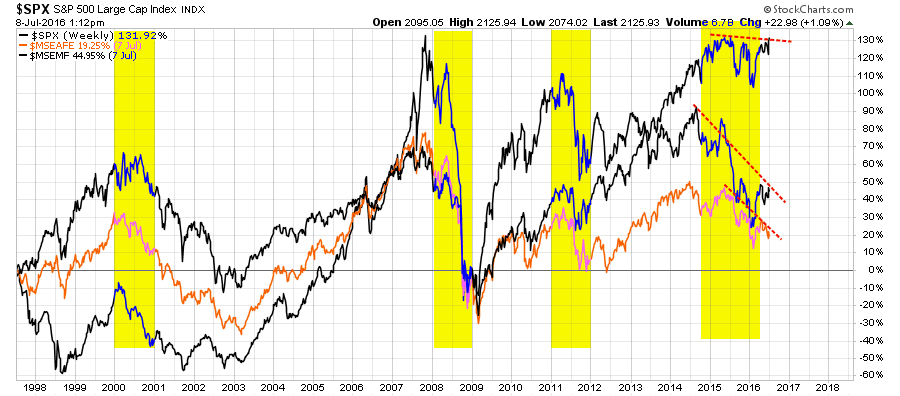
Again, while this does not mean a market reversion is imminent, anomalies in historical correlations have tended not to be long lasting. It is just something worth considering as an investor.
SECTOR BY SECTOR
The analysis of the broad market index gives us some clues about the overall risks being undertaken by investors currently. However, this week, I want to take a look at individual sectors and major asset classes to determine what actions may need to be taken in the week ahead while we await confirmation of the market’s potential “breakout.”
To eliminate the “noise” of daily price movements, I am utilizing a “weekly” chart comprised of 24-months of price data.
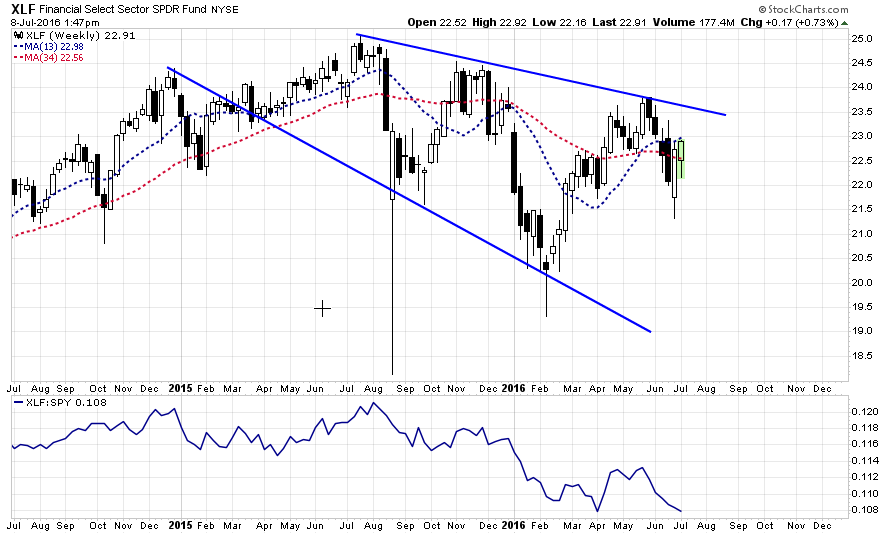
Financials
Bank stocks remain in a down trend and continue to significantly under perform the broader market index. Given the current level of interest rates and underweight position in the sector, there is little expectation of substantial outperformance in the near term.
Buy/Sell/Hold/Add: Hold
Weighting: Underweight In Portfolio
Health Care
Health Care stocks broke out of their downtrend in May and made a successful retest of support and have now moved higher. With relative performance increasing the potential for continued outperformance in the near term is likely. Furthermore, this sector is part of the “yield chase” crowd and is pushing more extreme over-valuation levels. Some caution is advised.
Buy/Sell/Hold/Add: Hold/Add
Weighting: Portfolio Weight

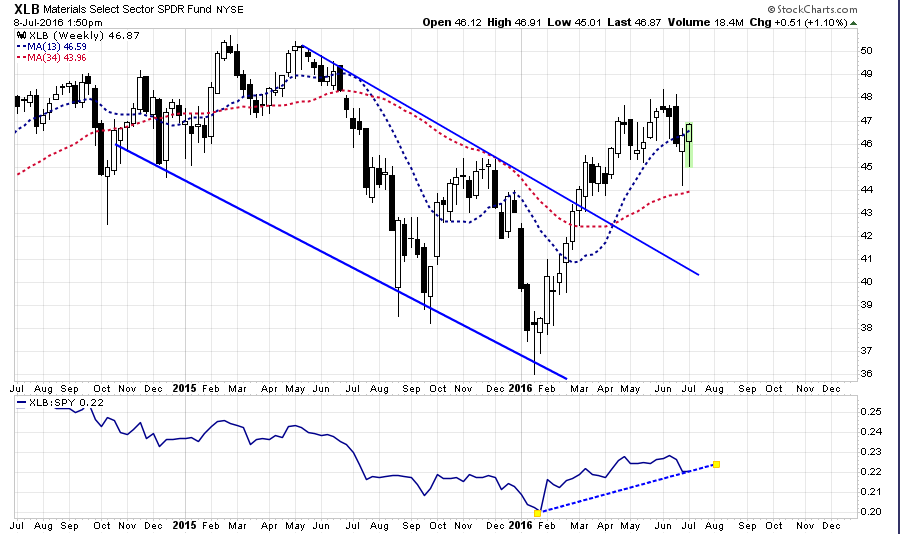
Basic Materials
Basic Materials have already experienced an extremely strong run primarily based on the “yield chase” given the extremely weak nature of the global economy. While sector performance is increasing, caution is advised as much of this sector is pushing rather extreme valuation levels.
Buy/Sell/Hold/Add: Hold
Weighting: Portfolio Weight
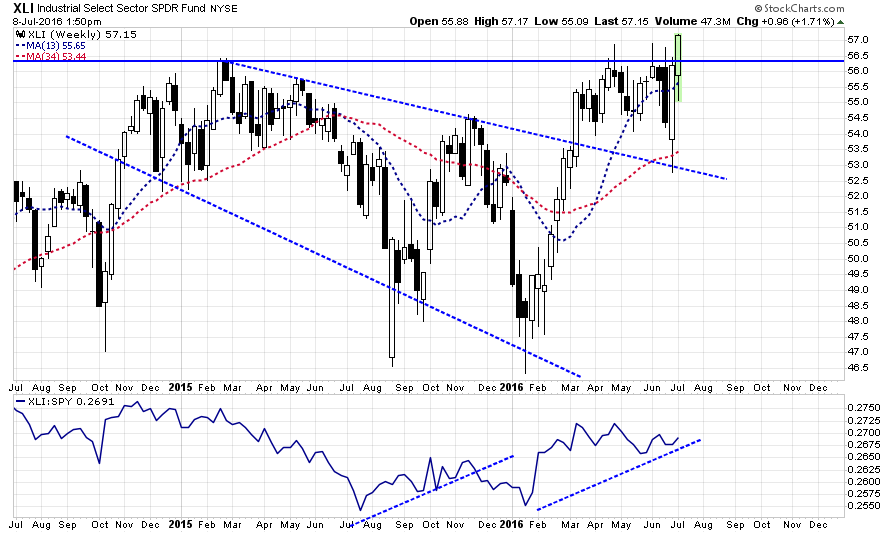
Industrials
Industrials broke out to a new high this past week showing continued strength in the ongoing “yield chase.” The push high in this sector is not really a sign of an increased upturn in industrial activity as railcar and transportation readings are still exceptionally weak.
Buy/Sell/Hold/Add: Hold/Add On Opportunity
Weighting: Portfolio Weight (Will look to overweight on opportunity)
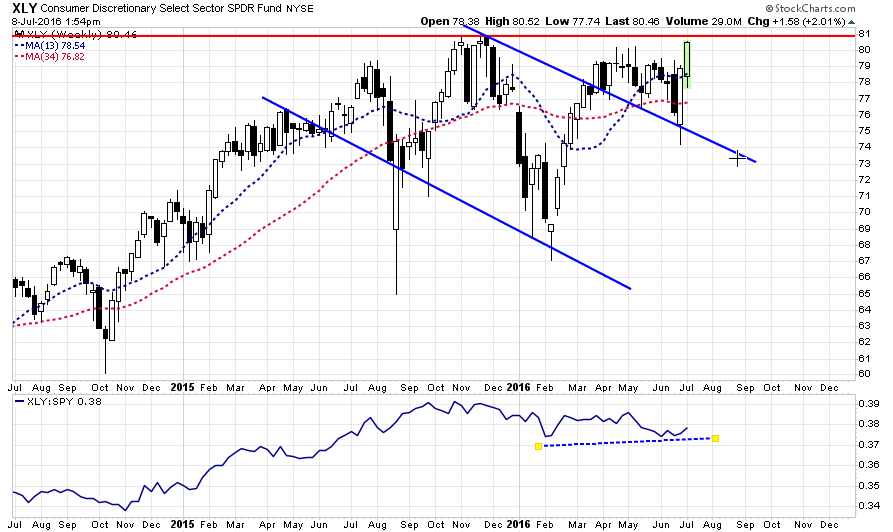
Consumer Discretionary
After a bit of struggle at the end of last year, the discretionary sector broke out of its downtrend and completed a successful retest of that downtrend over the last couple of weeks. As with industrials, if this sector can break out above overhead resistance there is a potential for further advances.
Buy/Sell/Hold/Add: Hold
Weighting: Portfolio Weight (Look to increase opportunistically on successful breakout.)
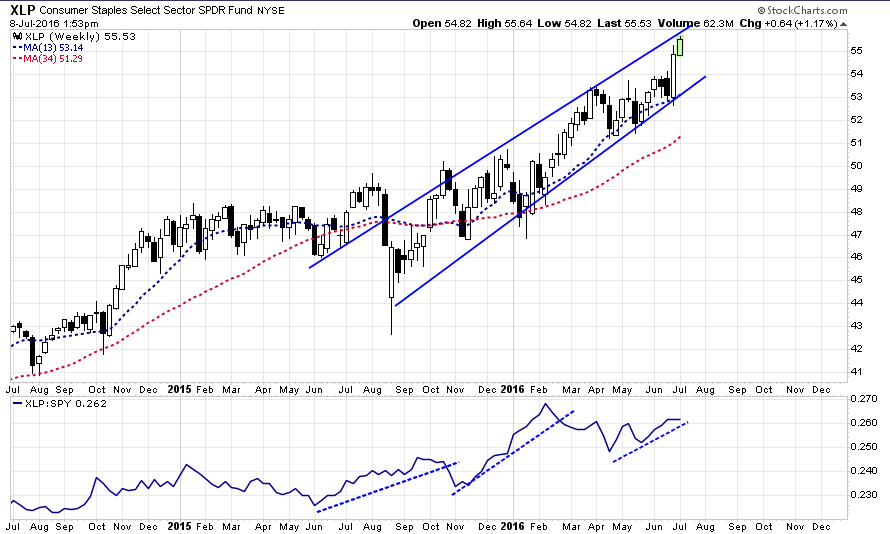
Consumer Staples
Staples continue to be a solid performer for investors. However, staples, like Utilities below, are EXTREMELY overvalued and overbought. Along with Industrials, the “yield chase” in these sectors have pushed prices to extremes. While technically these sectors should remain in portfolios, it comes with a Surgeon General’s Warning: “Chasing Yield Is Hazardous To Your Health.”
Buy/Sell/Hold/Add: Hold (Take Profits)
Weighting: Portfolio Weight

Utilities
As stated above, like Staples, the “Yield Chase” is at extremes. Continue to hold the sector for now, but reduce current positions back to original portfolio weights through prudent profit taking measures.
Buy/Sell/Hold/Add: Hold (Take Profits)
Weighting: Portfolio Weight
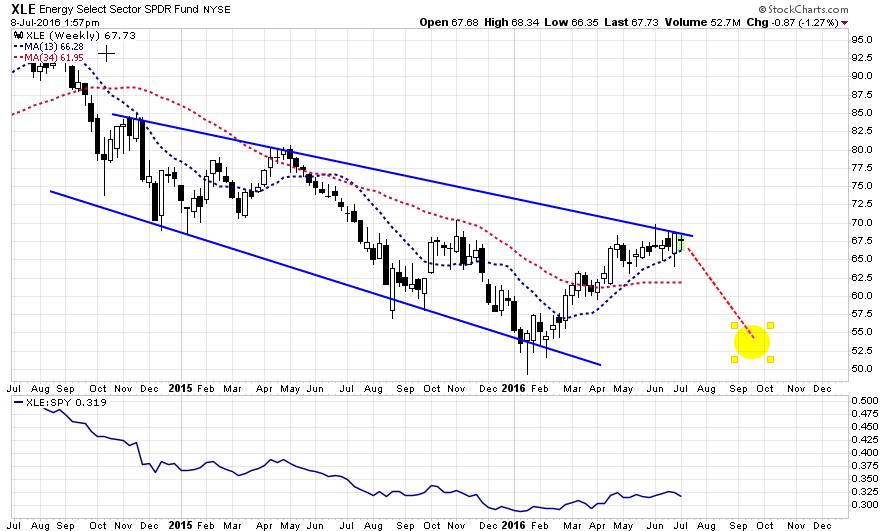
Energy
There are two things about the energy sector. While the push from the lows has been fairly strong in recent months, the ongoing downtrend remains intact. If the market does turn lower in the August/September period as expected the potential to retest lows is fairly high.
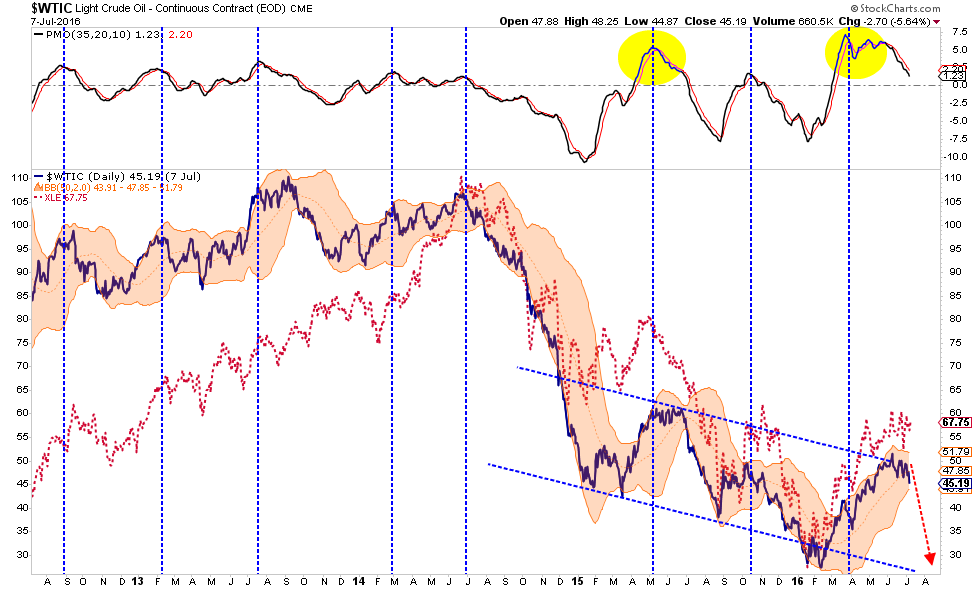
As shown in the longer term oil chart below, there is little to suggest a recovery back to old levels is in the offing anytime soon. With oil prices back to extreme overbought conditions, a retracement to $35 or $40/bbl would not be surprising particularly if, and when, the US Dollar strengthens. Remain underweight this sector as valuations for energy stocks have entered into “moon shot” territory.
Buy/Sell/Hold/Add: Hold (Take Profits)
Weighting: Underweight In Portfolio
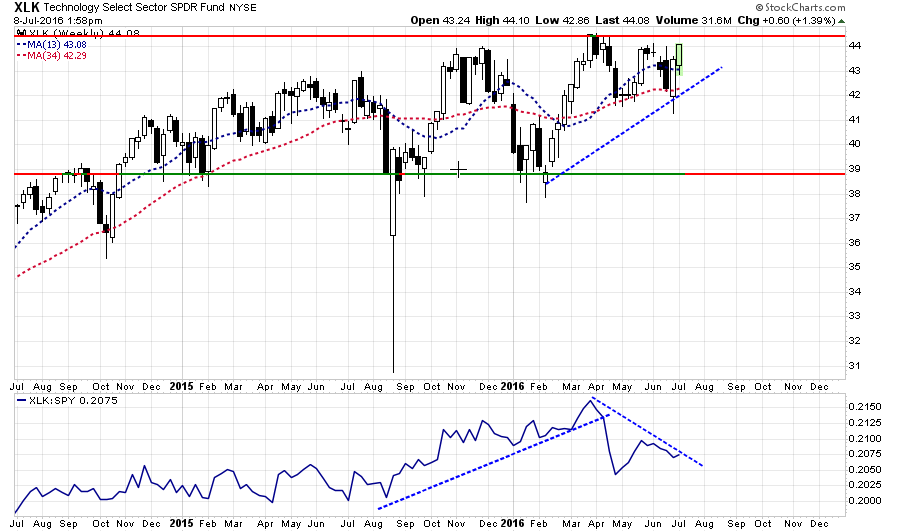
Technology
Like the Discretionary sector, Technology has been working a very quiet uptrend. However, don’t get too excited just yet as this sector has been a weak performer as of late and remains encapsulated in a sideways trend. Hold positions for now and look for a breakout above resistance. If this happens we will re-evaluate our weighting recommendations.
Buy/Sell/Hold/Add: Hold
Weighting: Underweight In Portfolio
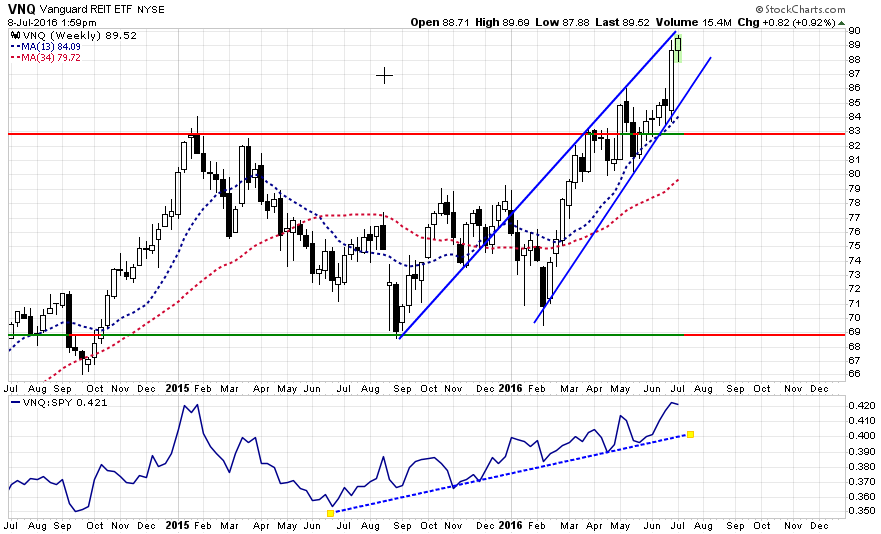
Real Estate
If the chart below looks like Utilities and Staples it shouldn’t surprise you. Another victim of the “yield chase” has been real estate which after breaking out above resistance has advanced sharply into extreme overbought territory. Take profits and reduce holdings back to original weighting levels.
Buy/Sell/Hold/Add: Hold (Take Profits)
Weighting: Portfolio Weight
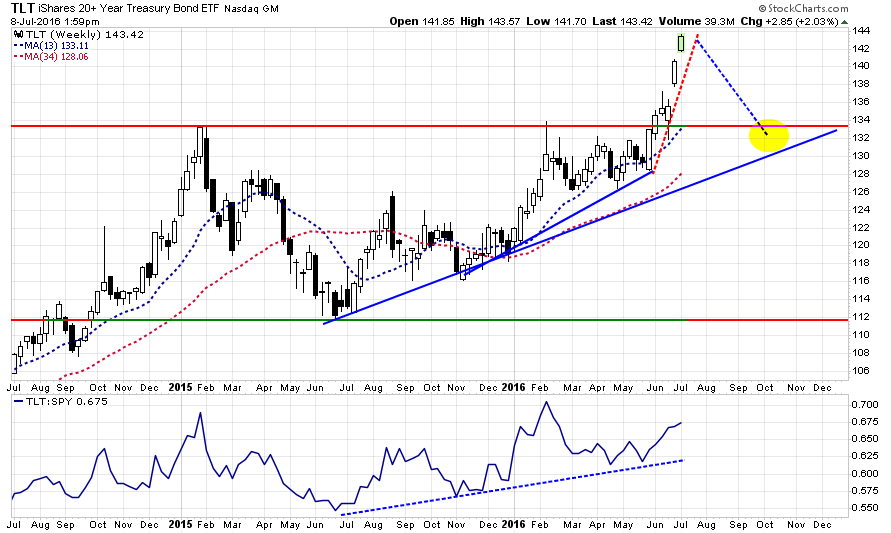
Bonds
The real anomaly to all of this analysis comes to bonds. The recent surge higher in the markets should have taken the “wind” out of bond investors as money rotated from“safety” back into “risk.” That has not been the case which does “raise the hair” on the back of my neck.
The current “parabolic” advance is unsustainable and profits should be taken and positions reduced back to original weightings. (I seem to keep repeating myself) If you are long individual bonds with set maturities, you could consider using a “short interest rate” exchange traded fund to hedge your current bond portfolio as well.
Importantly, a push higher in both stocks and bonds is historically unsustainable. In other words, someone is going to be wrong. Let’s take some money off the table and wait and see who’s right.
Buy/Sell/Hold/Add: Hold (Take Profits)
Weighting: Portfolio Weight
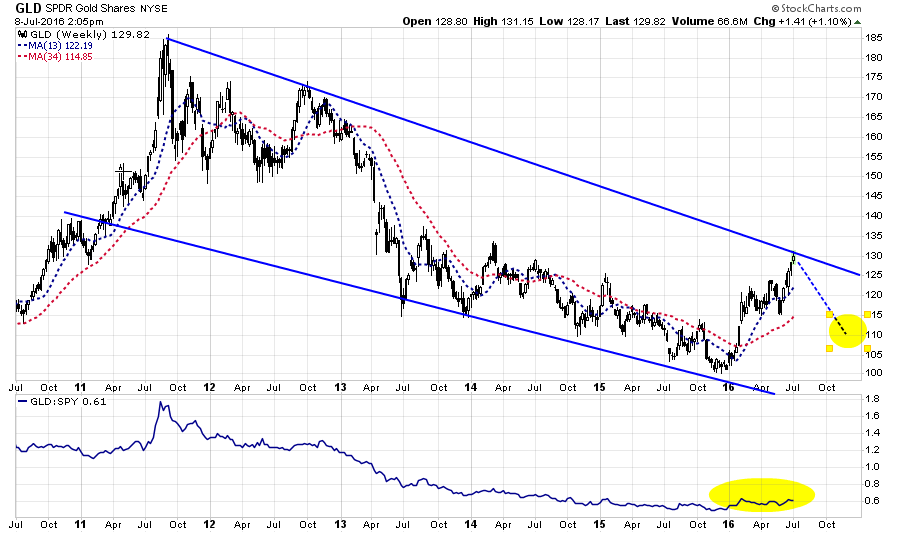
Gold
In January 2013, I recommended selling Gold entirely out of portfolios. That has been a good call since then. The recent push higher in Gold, given the “Brexit” fears, has pushed prices back to the top of the long-term trend line. With the asset extremely overbought, long holdings should be trimmed back to original weights.
Furthermore, if the recent breakout in the markets holds, and the bull market does resume, then gold prices will fall back towards the bottom of the long-term trend channel. If gold does break out of the long-term downtrend, portfolio weightings will be reconsidered.
Buy/Sell/Hold/Add: Hold (Take Profits)
Weighting: Underweight In Portfolio
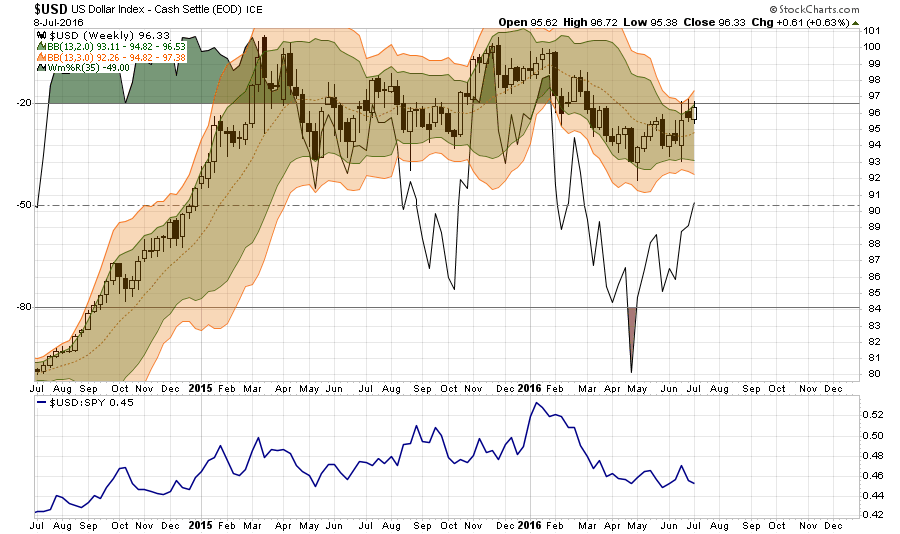
USD
The US Dollar is the key to potential outcomes. My expectations are that with the dollar coming off of oversold levels, a steady advance back to old highs is likely. This will particularly be the case as China, and its economy, slowly comes apart. This will negatively impact oil prices, energy stocks, corporate earnings and eventually the stock market itself. Pay attention to the dollar in the months ahead.
PORTFOLIO ACTIONS (Reprisal)
As stated above, we need to see the market confirm the breakout on Friday by staying above 2100 for the entirety of next week. For now, it is prudent to use the push higher on Friday to continue to clean up portfolios and prepare for any actions that need to be taken in the near future.
If you have not taken any actions over the last few weeks, this is a good opportunity to clean up and reduce excess risk in portfolios. Continue with the steps laid out in the“Monday Morning Call” Section a few weeks ago:
- Tighten up stop-loss levels to current support levels for each position.
- Hedge portfolios against major market declines.
- Take profits in positions that have been big winners
- Sell laggards and losers
- Raise cash and rebalance portfolios to target weightings.
Importantly, while short-term indicators are turning more bullish, long-term dynamics are still very weak. However, beginning next week we enter into 2nd quarter earnings season and with expectations already VERY low, announcements could provide a short-term lift to the markets.
Major risks to the market still remain the upcoming election and China. Stay tuned.
THE MONDAY MORNING CALL
The Monday Morning Call – Analysis For Active Traders
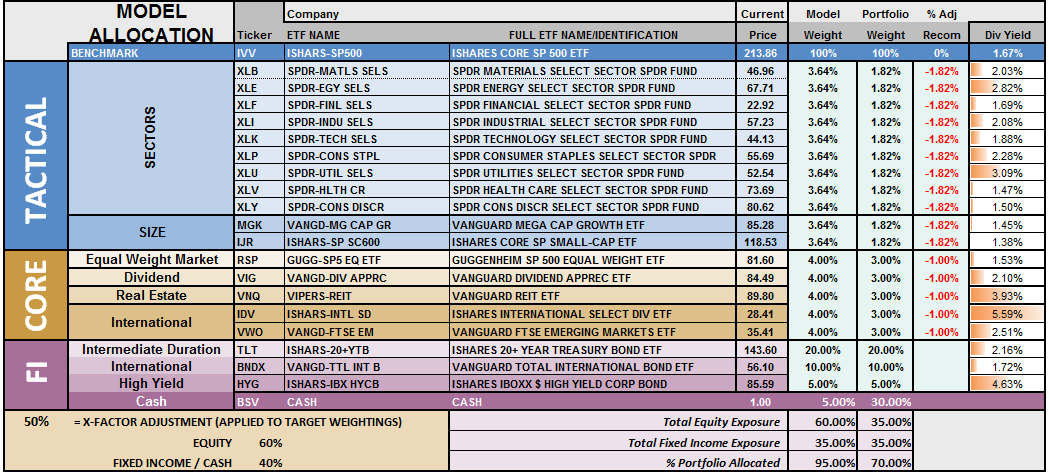
S.A.R.M. Model Allocation
The Sector Allocation Rotation Model (SARM) is an example of a basic well-diversified portfolio. The purpose of the model is to look “under the hood” of a portfolio to see what parts of the engine are driving returns versus detracting from it. From this analysis, we can then determine where to overweight sectors which are leading performance, reduce in areas lagging, and eliminate those areas that are dragging.
This past week’s volatility didn’t change the backdrop of the market much. However, it is worth noting that the leadership of energy, basic materials, small and mid-cap is fading along with the relative performance of healthcare and financials. Somewhat surprisingly, given the rally in the market last week, Bonds and REITs surged to leadership positions in the market. Not something that should have happened.
The sector recommendations over the last three weeks, shown below, have paid off handsomely over the last couple of weeks. This week follow the sector recommendations above in the main body of this missive.
S.A.R.M. Sector Analysis & Weighting
The current risk weighting remains at 50% this week.
While the market did push above resistance, a sustained breakout through next week is required to confirm that advance. As I stated last week:
“With technical underpinnings still ‘bullishly biased,’ we want to give the markets the benefit of the doubt for now.”
However, despite the rally, the longer term technical underpinnings still remain weak so caution is still necessary for now.
Relative performance of each sector of the model as compared to the S&P 500 is shown below. The table compares each position in the model relative to the benchmark over a 1, 4, 12, 24 and 52-week basis.
Historically speaking, sectors that are leading the markets higher continue to do so in the short-term and vice-versa. The relative improvement or weakness of each sector relative to index over time can show where money is flowing into and out of. Normally, these performance changes signal a change that last several weeks.
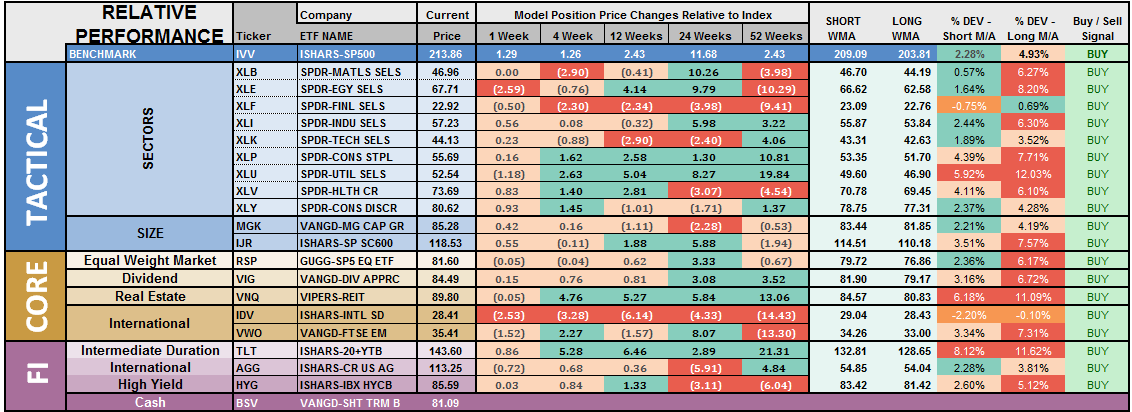
The last column is a sector specific “buy/sell” signal which is simply when the short-term weekly moving average has crossed above or below the long-term weekly average. The number of sectors on “buy signals” has improved from just 2 a few weeks ago to 19 this past week.
The risk-adjusted equally weighted model remains from last week. No changes this week.
The portfolio model remains at 35% Cash, 35% Bonds, and 30% in Equities.
As always, this is just a guide, not a recommendation. It is completely OKAY if your current allocation to cash is different based on your personal risk tolerance, time frames, and goals.
For longer-term investors, we need to see an improvement in the fundamental and economic backdrop to support a resumption of the bullish trend. Currently, there is no evidence of that occurring.
THE REAL 401k PLAN MANAGER
The Real 401k Plan Manager – A Conservative Strategy For Long-Term Investors
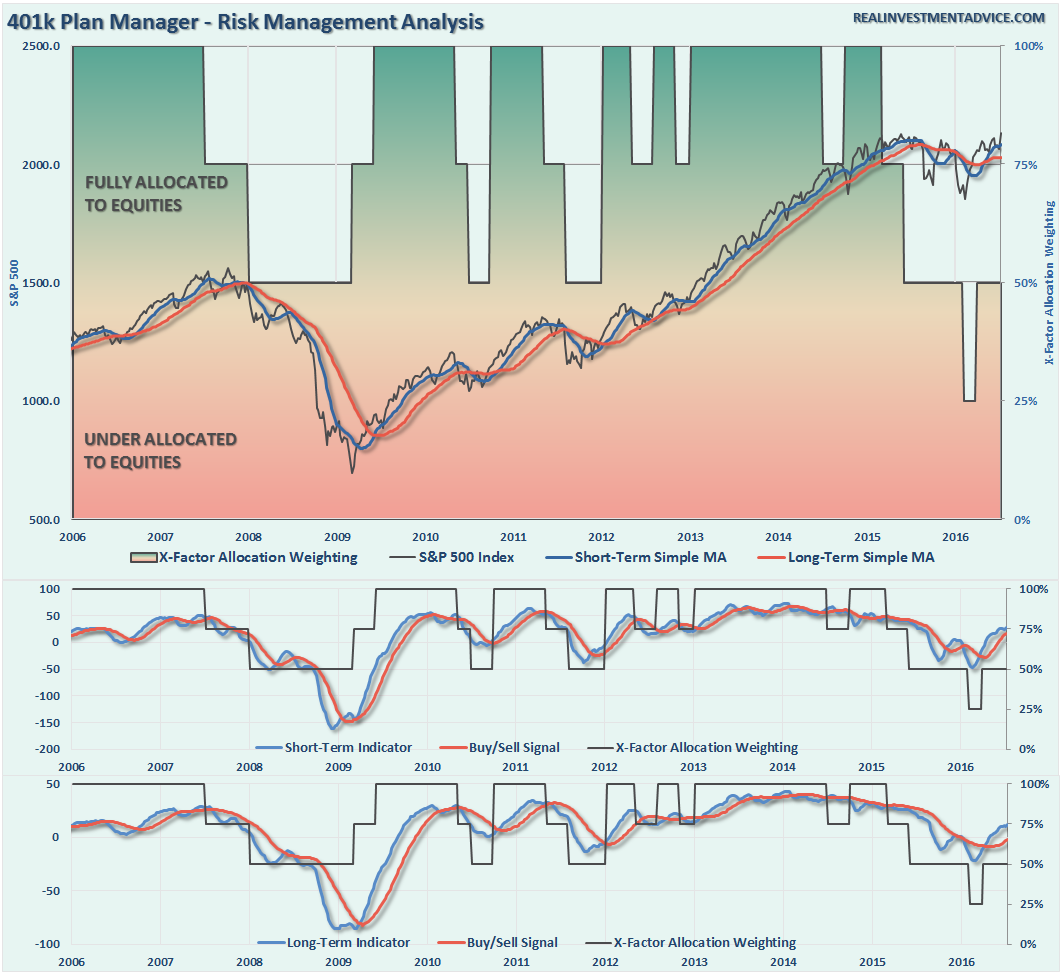
NOTE: I have redesigned the 401k plan manager to accurately reflect the changes in the allocation model over time. I have overlaid the actual model changes on top of the indicators to reflect the timing of the changes relative to the signals.
There are 4-steps to allocation changes based on 25% reduction increments. As noted in the chart above a 100% allocation level is equal to 60% stocks. I never advocate being 100% out of the market as it is far too difficult to reverse course when the market changes from a negative to a positive trend. Emotions keep us from taking the correct action.

Breakout? Waiting For Confirmation
As I discussed last week, the fear of “Brexit” related impacts sent Central Banks into overdrive to push asset prices higher. As noted repeatedly above, while the market did break above resistance we need to wait for confirmation through the end of next week.
With the technical underpinnings still bullishly biased at the moment, we are now in the position to increase equity allocations over the next couple of weeks.
However, while I make that statement, it is also important to realize the fundamental and economic dynamics still tilt long-term risk/reward ratios out of favor. But, as investors, we must capitalize on trends should such trends return to a positive basis.
For longer-term investors, the markets have made virtually no progress since January of 2015. Therefore, there is little evidence to suggest stepping away from a more cautionary allocation…for now but that could be changing.
Patience for one more week.
If you need help after reading the alert; don’t hesitate to contact me.
Current 401-k Allocation Model
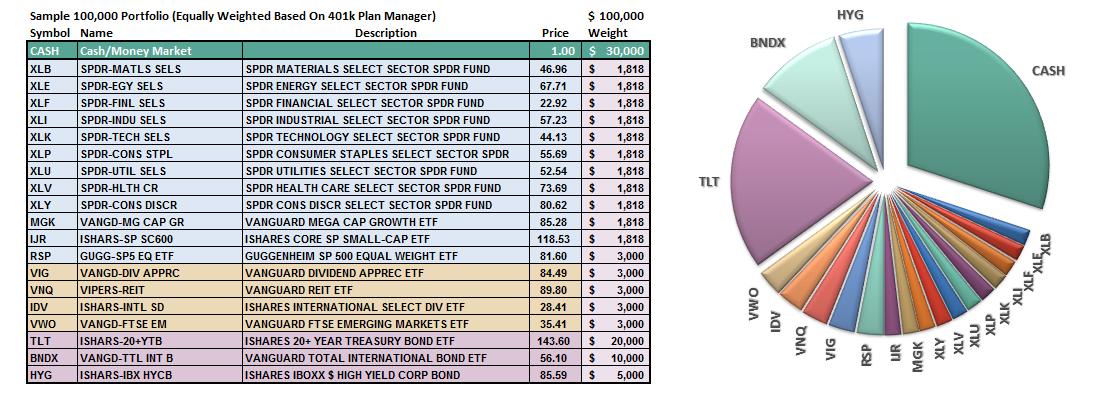
The 401k plan allocation plan below follows the K.I.S.S. principal. By keeping the allocation extremely simplified it allows for better control of the allocation and a closer tracking to the benchmark objective over time. (If you want to make it more complicated you can, however, statistics show that simply adding more funds does not increase performance to any great degree.)

401k Choice Matching List
The list below shows sample 401k plan funds for each major category. In reality, the majority of funds all track their indices fairly closely. Therefore, if you don’t see your exact fund listed, look for a fund that is similar in nature.

Disclosure: The information contained in this article should not be construed as financial or investment advice on any subject matter. Streettalk Advisors, LLC expressly disclaims all liability in ...
more

