
“All In” On Tax Reform

In last week’s “Technically Speaking” post I discussed the S&P 500 hitting 2700 by Christmas. To wit:
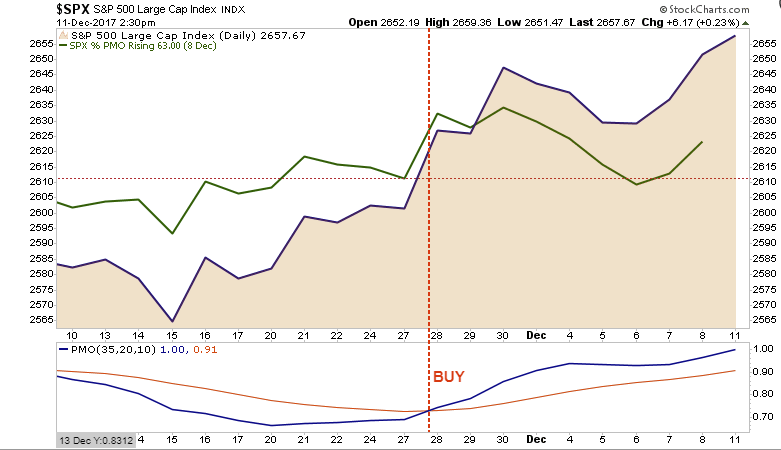
“As stated in the title, the current push higher puts 2700 in sight by the time Santa fills the ‘stockings hung by the chimney with care.’
As shown below, price momentum triggered a short-term “buy” signal following Thanksgiving, and after the brief ‘AMT Tax Debacle’ in the Senate Tax Bill, momentum again has turned up as prices continue to press higher.”
As noted above, this “momentum” keeps portfolios allocated towards equity risk, but we continue to be prudent about the risk we are taking and continue to hedge risk as necessary.
After discussing that “dip” in the market caused by concerns over the current “tax reform” proposal, I followed up with an analysis of the Federal Reserve’s balance sheet manipulations. Unsurprisingly, I discovered the following:
“With global Central Banks still flooding the system with liquidity, the Fed has yet to begin rolling off their reinvestments as expected. In fact, the Fed made a timely reinvestment during the “Senate Tax Bill” debacle earlier this month.”
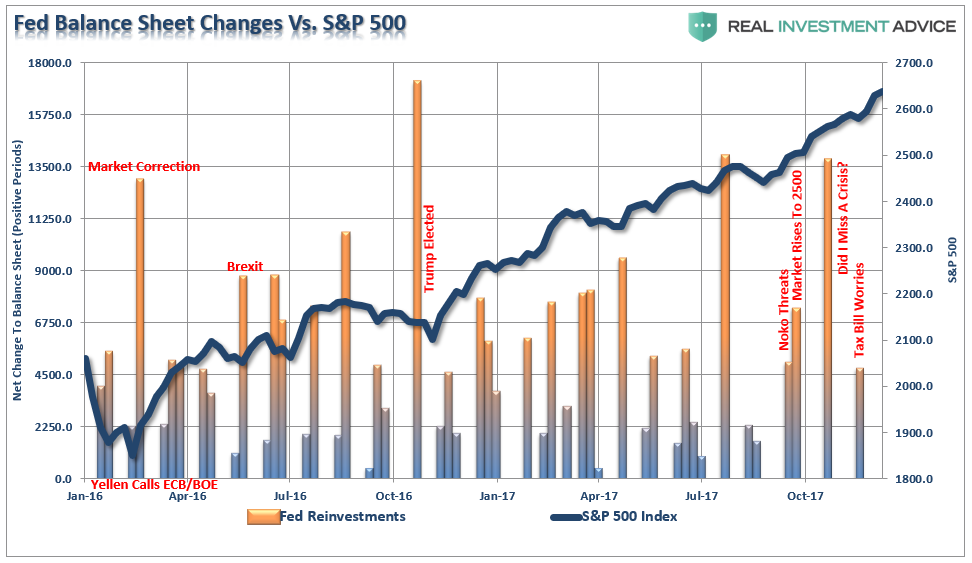
Of course, that bump of liquidity sent asset prices rocketing higher.
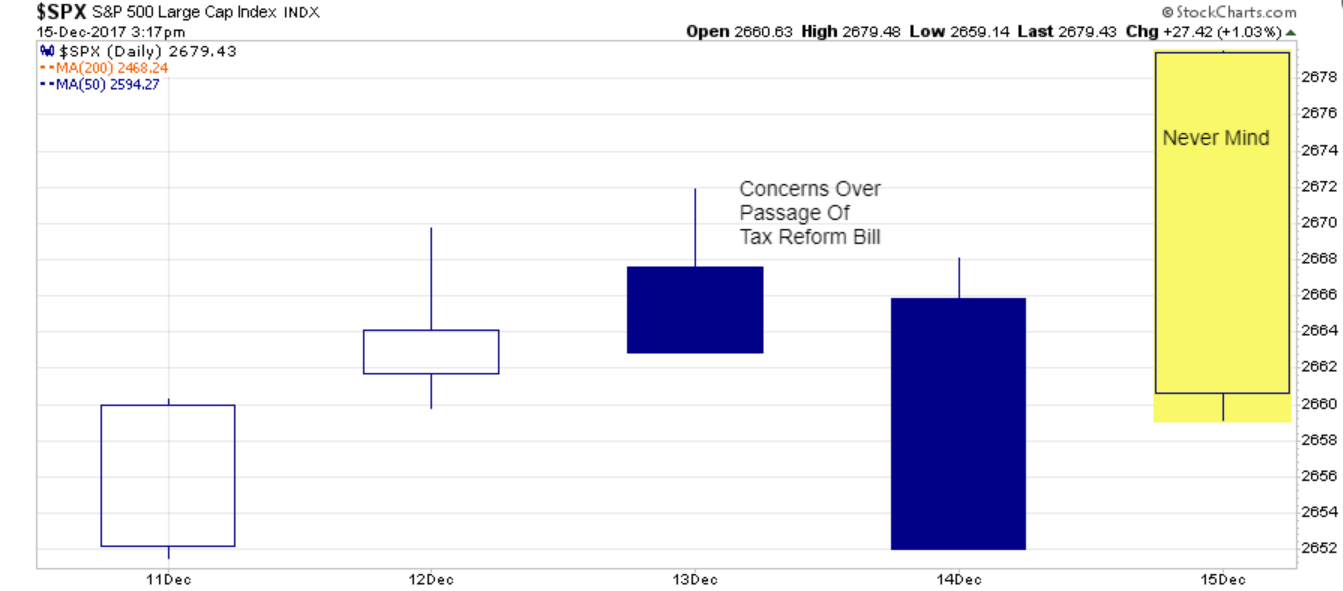
Then on Thursday, we saw a brief slide in equities as concerns once again rose over the potential for the tax reform legislation to be blocked by several Senators who were leaning towards voting “no” on the bill. However, those concerns lasted only momentarily and stocks rocketed higher on Friday ending the week on a positive note. With concerns over tax reform fading, equities are sitting at all-time highs and within striking distance of 2700 by Christmas.
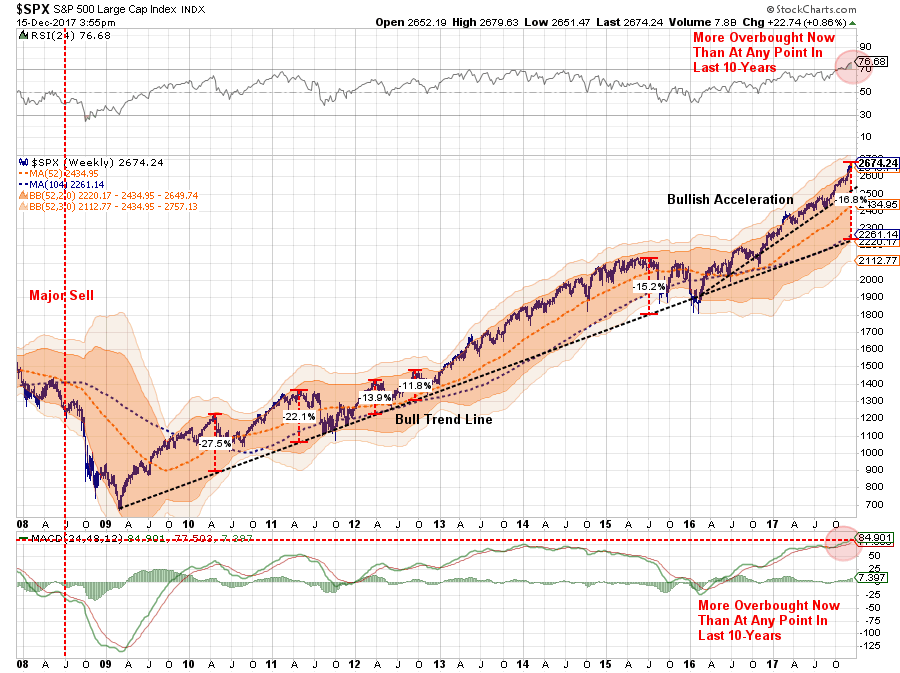
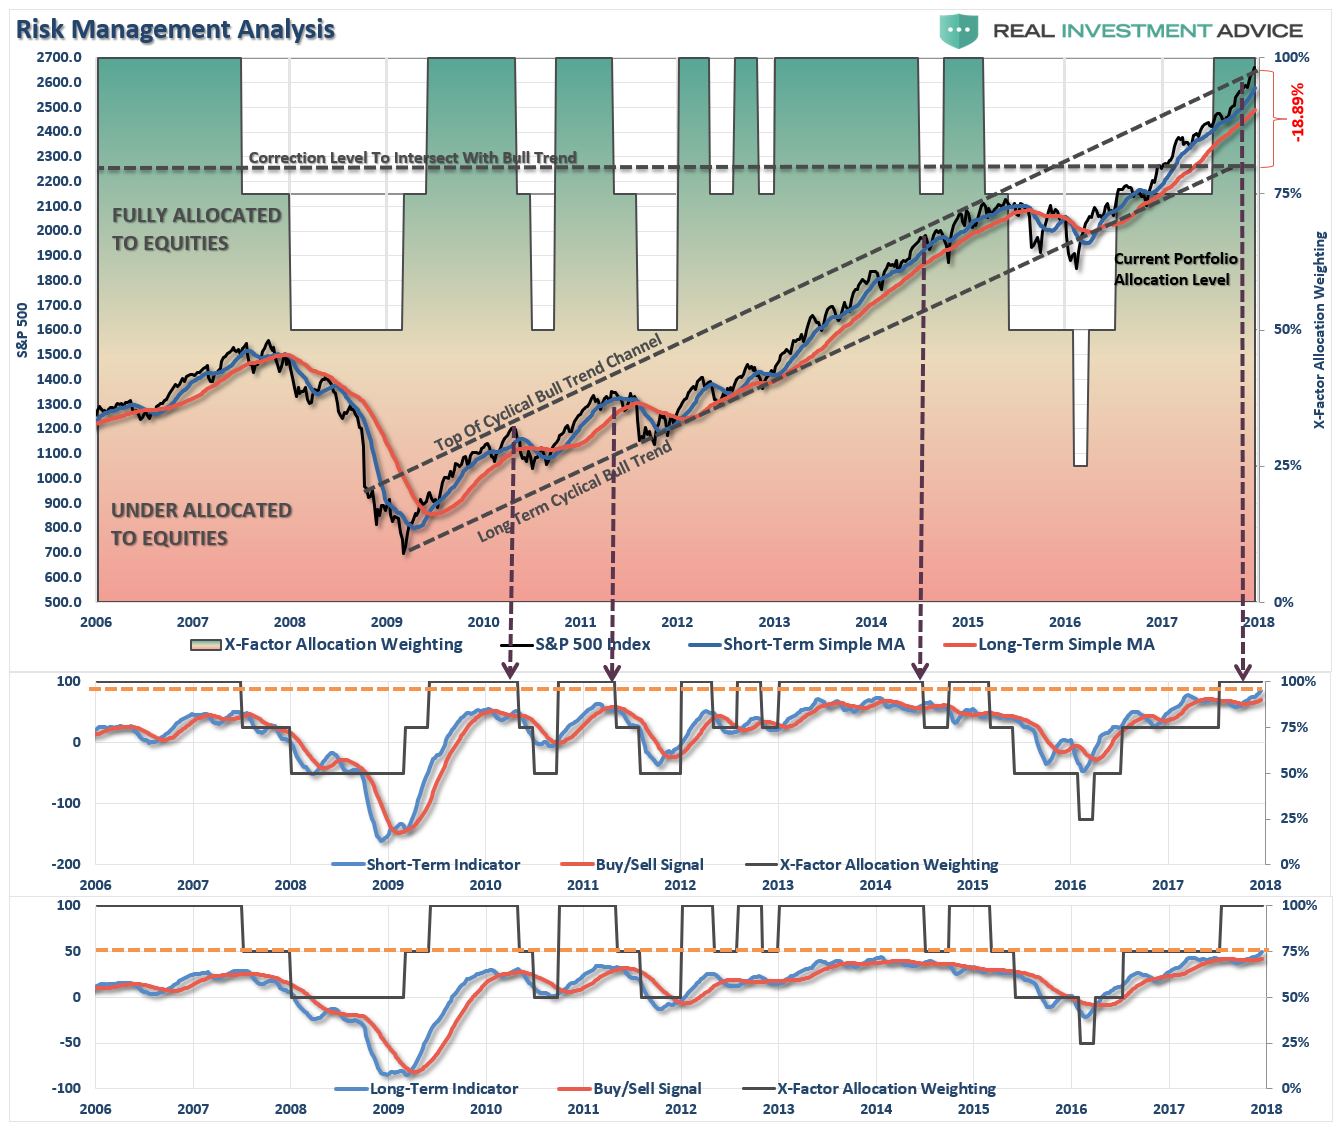
The current technical underpinnings remain bullish currently, but as shown below, are pushing into extremely overbought conditions. The chart below shows the 1 and 2-year moving averages with 2 and 3-standard deviations of the 1-year moving average. That deviation, combined with the most overbought readings on both RSI and MACD, suggest risk has risen markedly in recent weeks.
While the conditions are very bullish heading into the end of the year, it is advisable that individuals take some actions in re-balancing risk in portfolios. As I noted last week in “The Exit Problem,” it is time to start considering sitting a little closer to the “exit.” To wit:
“Am I sounding an ‘alarm bell’ and calling for the end of the known world? Should you be buying ammo and food? Of course, not.
However, I am suggesting that remaining fully invested in the financial markets without a thorough understanding of your ‘risk exposure’ will likely not have the desired end result you have been promised.
As I stated often, my job is to participate in the markets while keeping a measured approach to capital preservation. Since it is considered ‘bearish’ to point out the potential ‘risks’ that could lead to rapid capital destruction; then I guess you can call me a ‘bear.’
Just make sure you understand I am still in ‘theater,’ I am just moving much closer to the ‘exit.’”
What does that mean? Here are the rules once again which guide the investment process in our shop. It is through following these basic rules that, with the markets overbought, underlying fundamentals stretched, we continue to suggest some portfolio actions be taken to reduce, not eliminate, overall risk.
-
- Tighten up stop-loss levels to current support levels for each position.
- Hedge portfolios against major market declines.
- Take profits in positions that have been big winners
- Sell laggards and losers
- Raise cash and rebalance portfolios to target weightings.
Notice, nothing in there says “sell everything and go to cash.”
However, being a bit more cautious at this juncture will likely pay dividends. As I have stated over the past several weeks, if tax reform does pass, it now looks likely that it will become effective in February, 2018. If that is the case, the setup for an early January/February sell-off in the markets is likely as portfolio managers lock in gains. While I have NOT added a short position to portfolios as of yet, the setup by year end is becoming much better with the excessive price extension in the market.
Final Tax Bill Details
On Friday, Kevin Brady of the House Ways and Means Committee was on my radio program discussing the bill which was released later that day.
Here are the details of the release he referenced in the interview.
- Seven rates, starting at 10 percent and reaching 37 percent for incomes above $500,000 for singles and $600,000 for married, joint filers. ALL EXPIRE IN 2025.
For joint filers:- 10 percent: $0 to $19,050
- 12 percent: $19,050 to $77,400
- 22 percent: $77,400 to $165,000
- 24 percent: $165,000 to $315,000
- 32 percent: $315,000 to $400,000
- 35 percent: $400,000 to $600,000
- 37 percent: $600,000 and above
For single filers:
- 10 percent: $0 to $9,525
- 12 percent: $9,525 to $38,700
- 22 percent: $38,700 to $70,000
- 24 percent: $70,000 to $160,000
- 32 percent: $160,000 to $200,000
- 35 percent: $200,000 to $500,000
- 37 percent: $500,000 and above
- Corporate Tax Rate – 21 percent, beginning in 2018.
- Pass-Through Deduction – Owners could apply a 20 percent deduction to their business income, subject to limits that would begin at $315,000 for married couples (or half that for single taxpayers).
- Individual State and Local Tax Deductions – Individuals can deduct no more than $10,000 worth of the deductions, which could include a combination of property taxes and either sales or income taxes.
- Obamacare Individual Mandate – Repeal the penalties.
- Mortgage Interest Deduction – Deductible mortgage interest for new purchases of homes would be capped at loans of $750,000.
- Medical Expense Deduction – Reduce the threshold to 7.5 percent of AGI for the tax years 2017 and 2018.
- Child Tax Credit – Double the credit to $2,000 and provide it for each child under 18 through 2024. Raise the phase-out amount to $500,000, and cap the refundable portion at $1,400 in 2018.
- Estate Tax – Double the thresholds so the levy applies to fewer estates. The higher thresholds would sunset in 2026.
Of course, the real question is how are you going to “pay for it?”
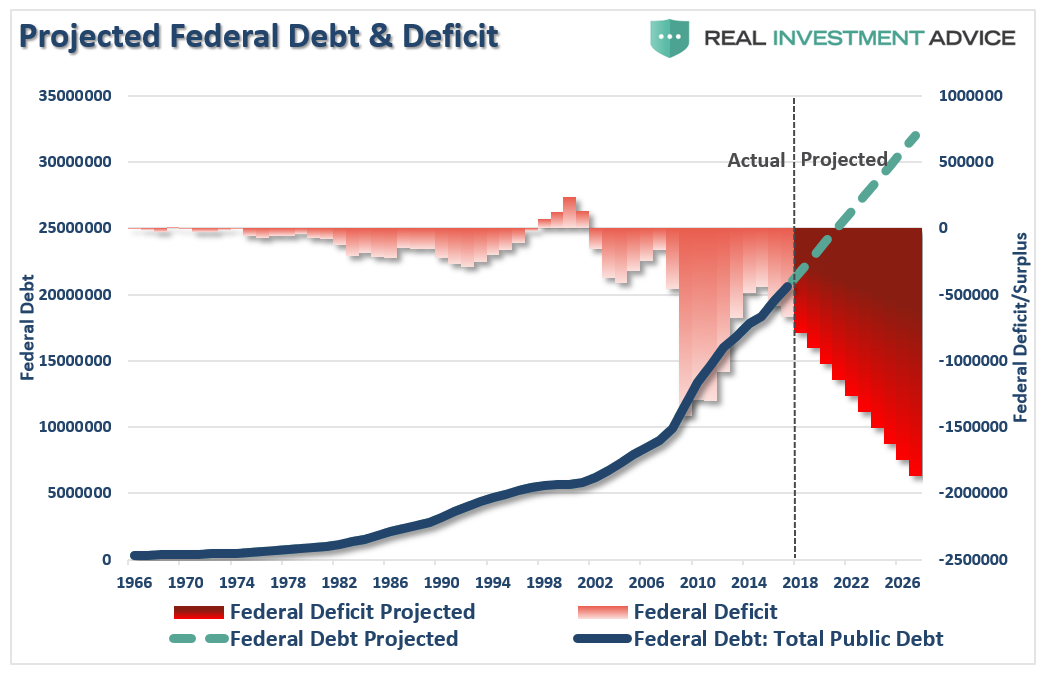
Even as Kevin Brady noted in our interview, when I discussed the “fiscal” side of the tax reform bill, without achieving accelerated rates of economic growth – “the debt will balloon.”
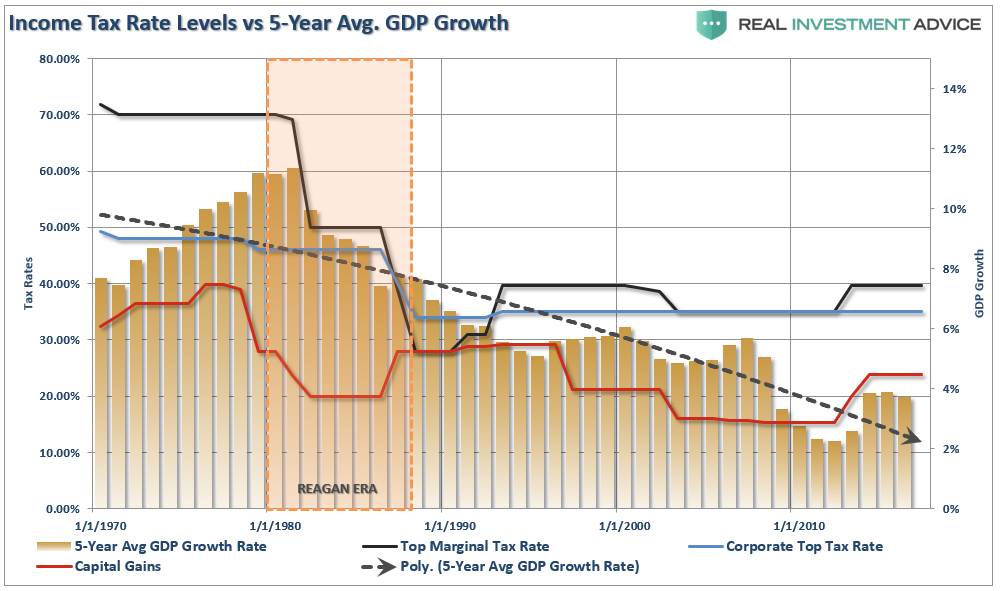
The reality, of course, is that is exactly what will happen because there is absolutely NO historical evidence that cutting taxes, without offsetting cuts to spending, leads to stronger economic growth.
Those, of course, are the long-term concerns that will lead to lower rates of returns for equity-based investors and will continue to suppress interest rates for the next decade as the “Japanification” of the U.S. continues.
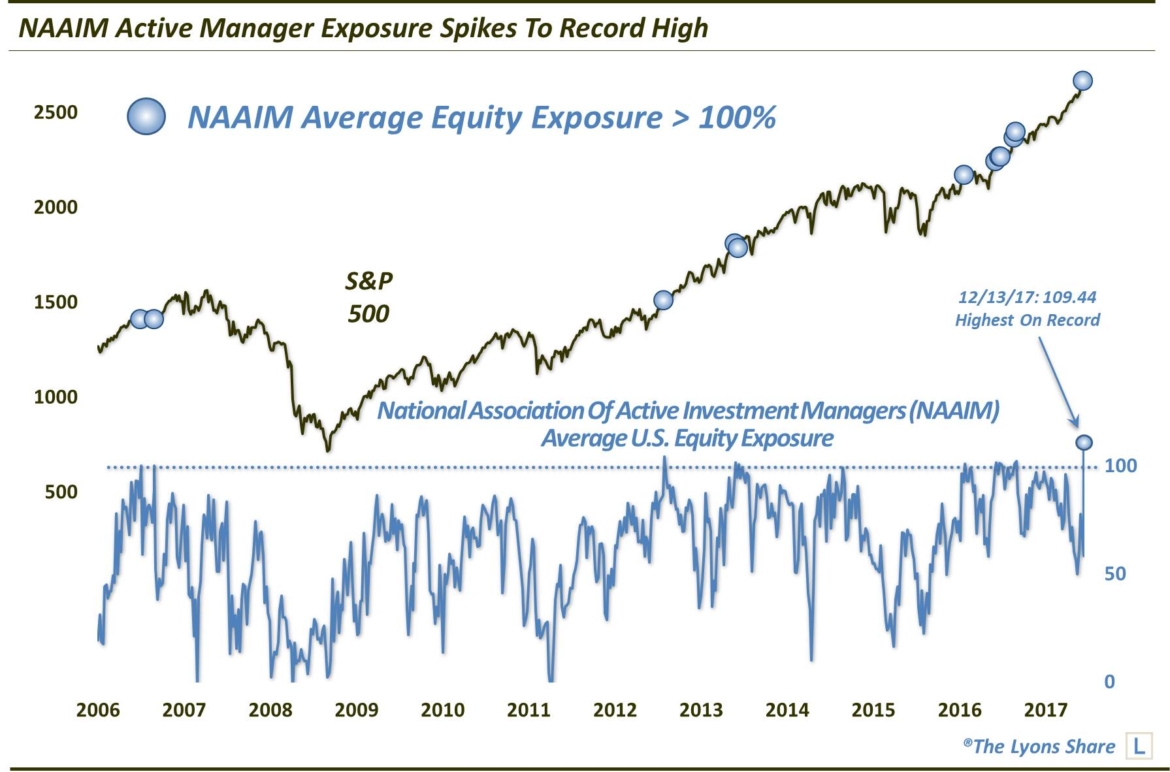
However, in the short-run investors have thrown caution to the wind. Not only are individual investors fully allocated to stocks as noted on Thursday, but professionals have gone “all-in” to chase returns into year-end as noted by my friend Dana Lyons on Friday. To wit:
“The National Association of Active Investment Managers, or NAAIM, is made up of Registered Investment Advisors and other money managers who employ active or tactical investment strategies as opposed to buy-&-hold and passive asset allocation. For the most part, the goal of such strategies is to reduce investment risk by applying processes to mitigate losses when they view markets as high-risk. Apparently, this group sees very little risk in the market at this time — or else they see Santa’s sleigh headed this way — because they’re currently throwing all caution to the wind.
That interpretation is according to the NAAIM Exposure Index, a survey of the group’s collective equity allocation. Based on the latest reading of the Index, these active managers have an average of 109% exposure to the stock market. Yes, 109%, meaning the average manager is leveraged long. That is the highest reading in the survey’s 11-year history, and the 12th reading over 100%.”
As I stated previously, there was no catalyst that we know of that burst the dot-com bubble in 2000. There was no catalyst that started the slide in the markets in 2008 until it triggered the Lehman bankruptcy and “all hell broke loose.”
Today, we once again have exuberance present and there is a widespread belief that nothing will stop this runaway train.
But eventually, for whatever reason, the market will top. It is impossible to predict when, or how it will happen. It just most assuredly will, and will do so just as everything seems to be its brightest.
“It will be the rudest of awakenings for the slumbering bulls.”
Market & Sector Analysis
Data Analysis Of The Market & Sectors For Traders
S&P 500 Tear Sheet
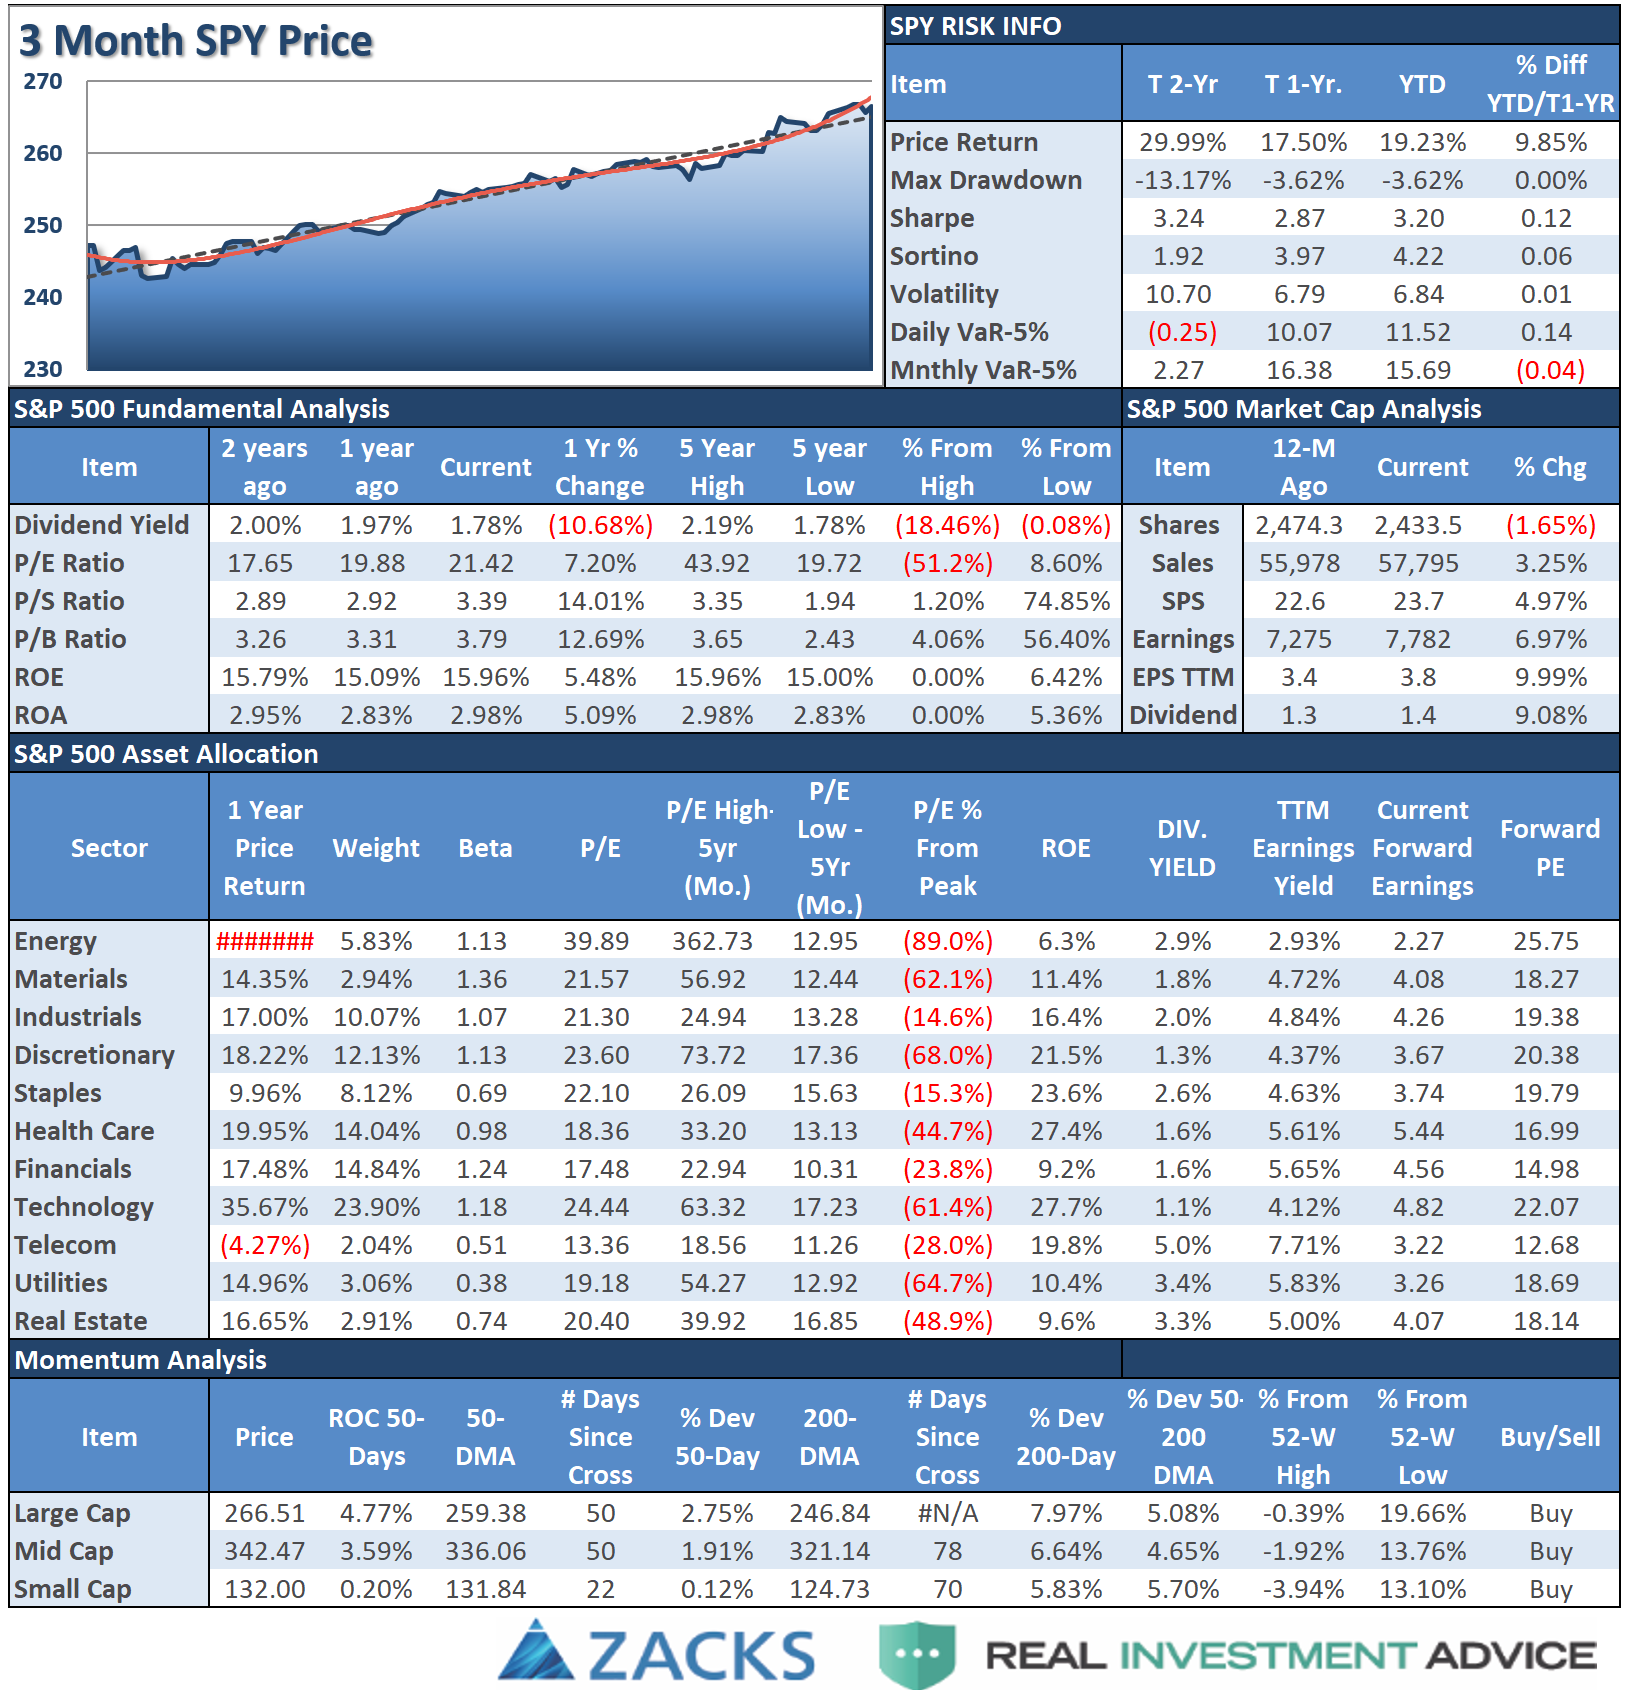
Performance Analysis
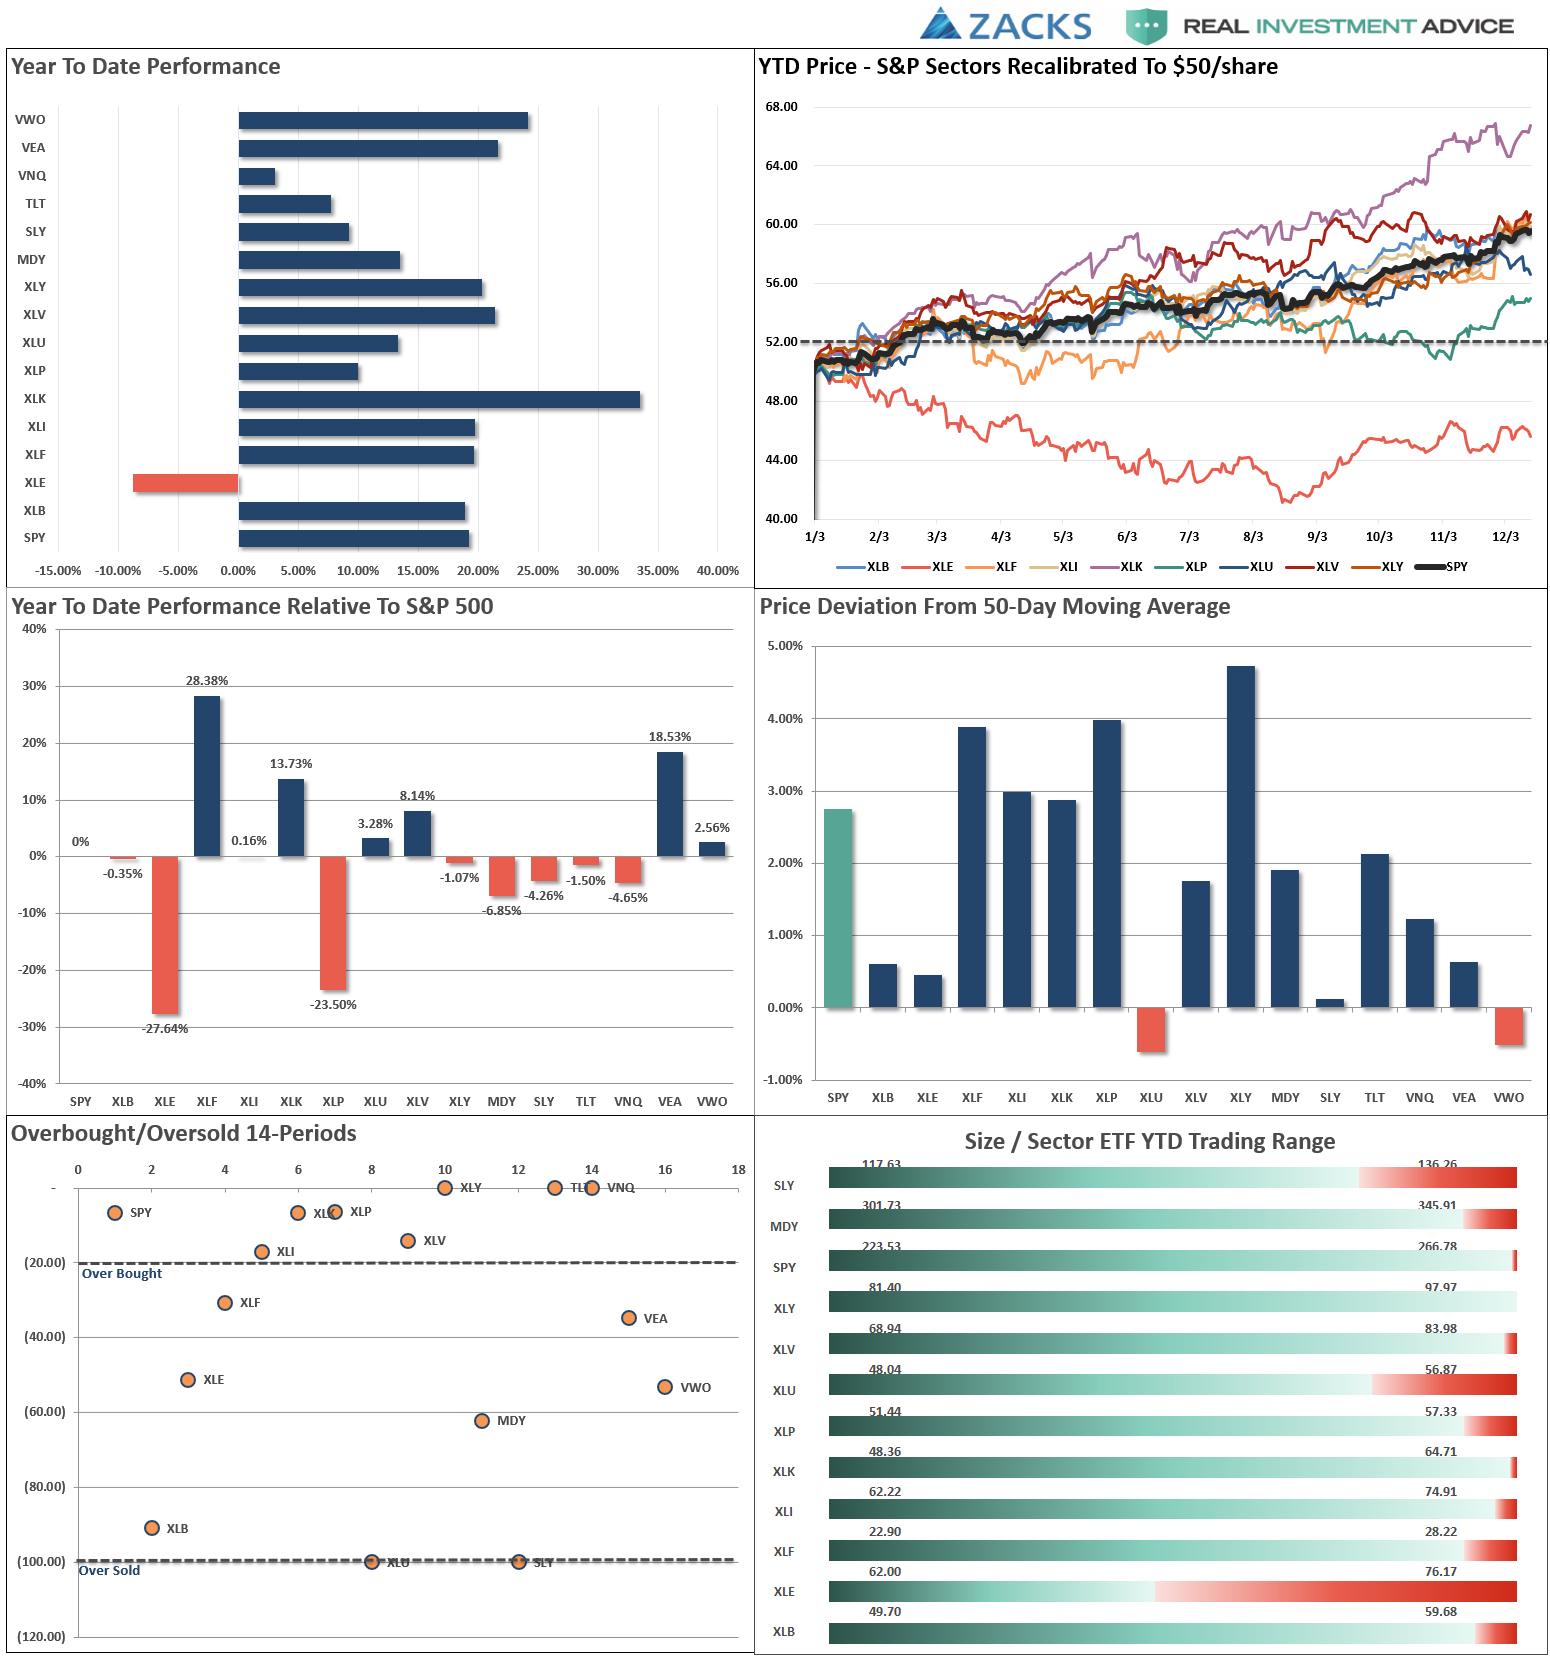
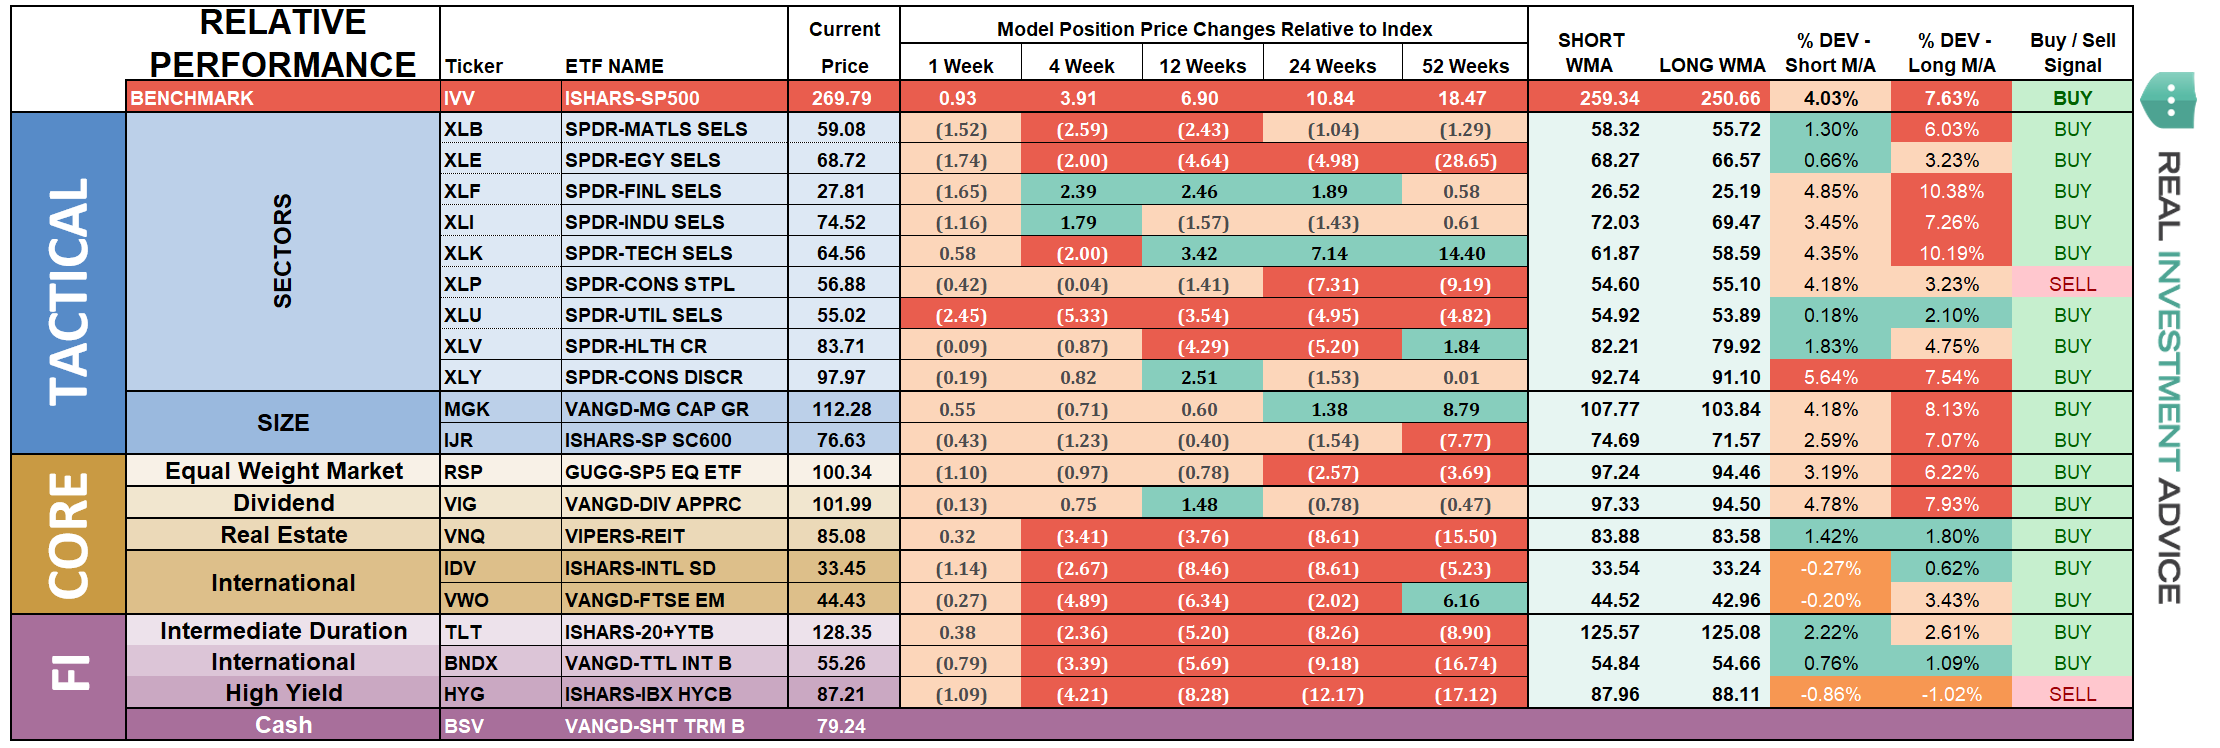
ETF Model Relative Performance Analysis
Sector & Market Analysis:
The current market advance both looks, and feels, like the last leg of a market “melt up” as we previously witnessed at the end of 1999. How long it can last is anyone’s guess. However, importantly, it should be remembered that all good things do come to an end. Sometimes, those endings can be very disastrous to long-term investing objectives. This is why focusing on “risk controls” in the short-term, and avoiding subsequent major draw-downs, the long-term returns tend to take care of themselves.
For now…the bulls remain clearly in control.

Discretionary, Staples, Industrials, and Financials continued to lead advances as they are viewed as the biggest beneficiaries of the tax bill. The near parabolic move is dangerous. These sectors are now GROSSLY extended. Take some profits, rebalance holdings and move stops up to recent breakout levels.
Technology- While it appeared Technology might have begun a consolidation or topping process previously, that is now over as the sector surged to new highs last week. The sector remains overbought, and the bounce off of support keeps the sector in a bullish trend.
Healthcare- as I noted previously, the sector had slipped below its 50-day moving average, however, the “buy everything” mode of the market over the last week resolved that situation keeping health care on hold in portfolios for now. Move stops up to the 50-dma for now.
Energy – as I noted previously the positive backdrop developing in the energy sector on a technical basis. We added one-half of a tactical trading position to portfolios last week and will monitor it as we head into the end of the year. We are maintaining a tight stop-loss if the position fails to hold support.
Utilities - we remain long the sector and have moved stops up to the 50-dma. Trends remain positive and interest rates have likely peaked for the current advance.
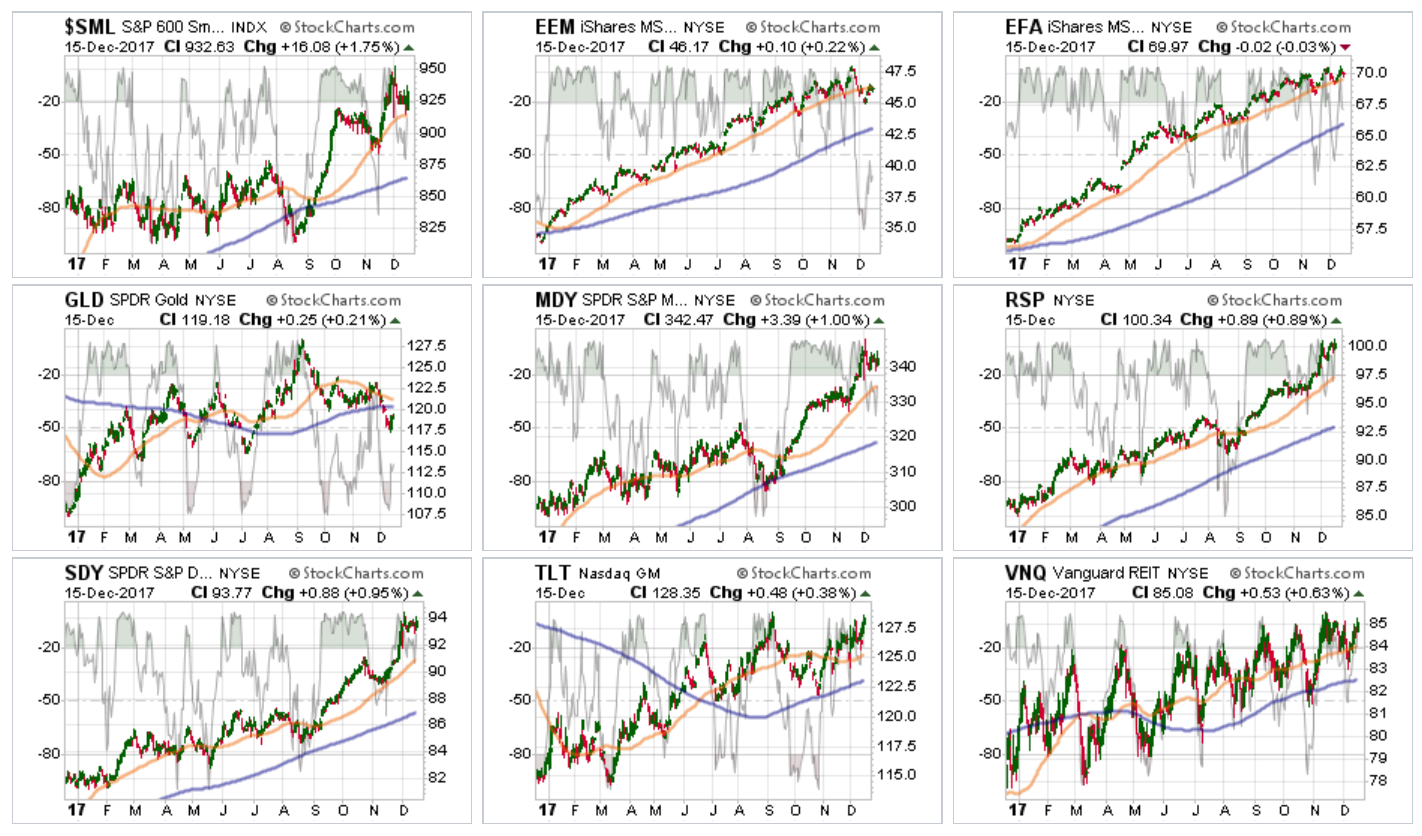
Small and Mid-Cap stocks along with the broader index struggled earlier this week on tax-reform concerns but rebounded at the end of the week. This is the second week in a row. Trends are positive which keeps allocations on hold but are too grossly extended currently to add positions.
Emerging Markets and International Stocks have shown some weakness as of late in terms of momentum, but remain in a bullish trend overall. We remain long these markets for now but have moved up stops accordingly. Emerging markets are oversold, but the sector is struggling with its 50-dma.
Gold – Gold failed to hold above the 50-dma last week and sharply violated the 200-dma this past week as bullishness over the market erased concerns of the need for safety. Importantly, with no catalyst to put “fear” into the market, the 50-dma starting to weaken putting the current risk back to the downside. We continue to watch the commodity currently, but remain on the sidelines for now.
S&P Equal Weight & Dividend Stocks – As noted previously, both of these positions have simply gone parabolic as money is chasing yield currently. We have moved up stops and are looking to take profits and rebalance accordingly.
Bonds and REIT’s – With“tax reform” being passed by the Senate, rates should be ticking up punishing bonds and REIT’s. However, that simply is not the case as the bond market continues to suggest that estimates of “tax reform” related economic growth is simply wrong. We remain long these sectors and continue to add to them on weakness.
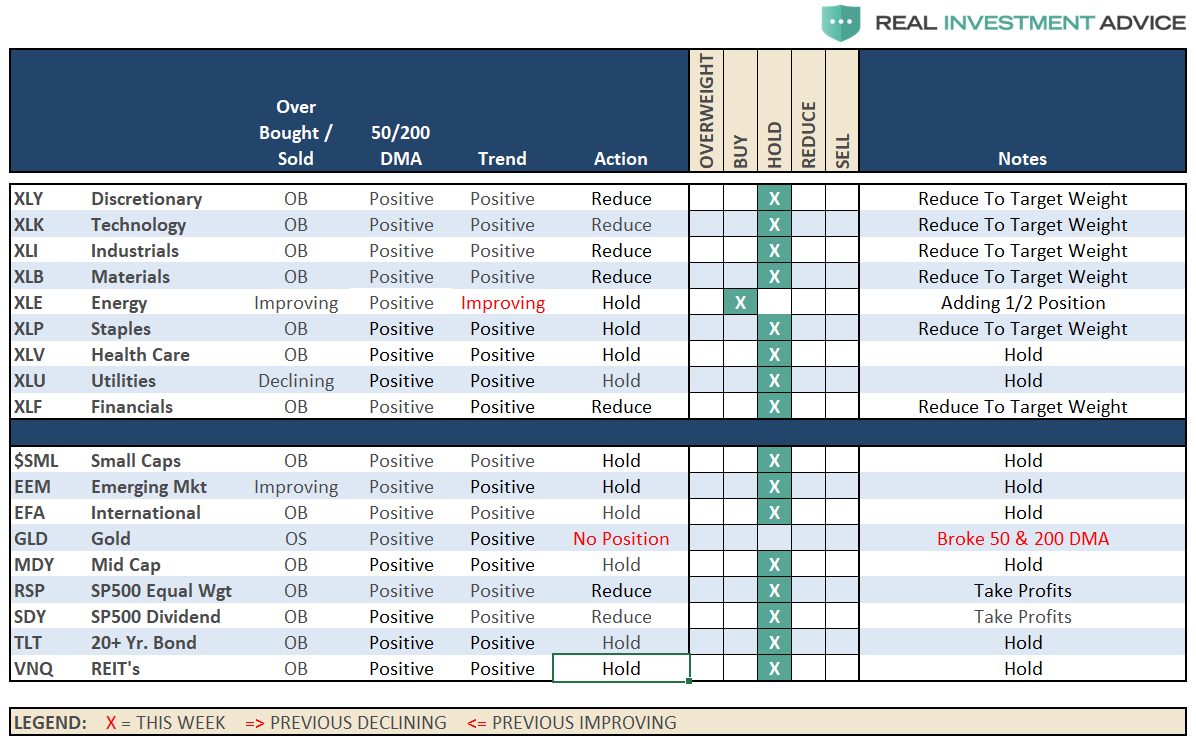
Sector Recommendations:
The table below shows thoughts on specific actions related to the current market environment.
(These are not recommendations or solicitations to take any action. This is for informational purposes only related to market extremes and contrarian positioning within portfolios. Use at your own risk and peril.)
Portfolio Update:
Let me repeat from last week:
“The market continued to hold its bullish trend this past week despite a pickup in volatility.This type of market is extremely dangerous as when markets break, and then immediately rebound, it lulls investors into a high degree of complacency that stocks “simply can’t go down.” While we are in the seasonally strong period of the year, we remain cognizant of the underlying risk.”
Also, as noted above, and previously, I am still looking for the right setup to hedge portfolios over the next couple of weeks.The surge this past week is putting us into the “ballpark.” I will keep you apprised.
As noted, we added 1/2 of a tactical trading position in Energy after an improvement in performance and recent bullish change in the technical underpinnings.
We remain invested but are becoming highly concerned about the underlying risk. Our main goal remains capital preservation.
THE REAL 401k PLAN MANAGER
The Real 401k Plan Manager – A Conservative Strategy For Long-Term Investors
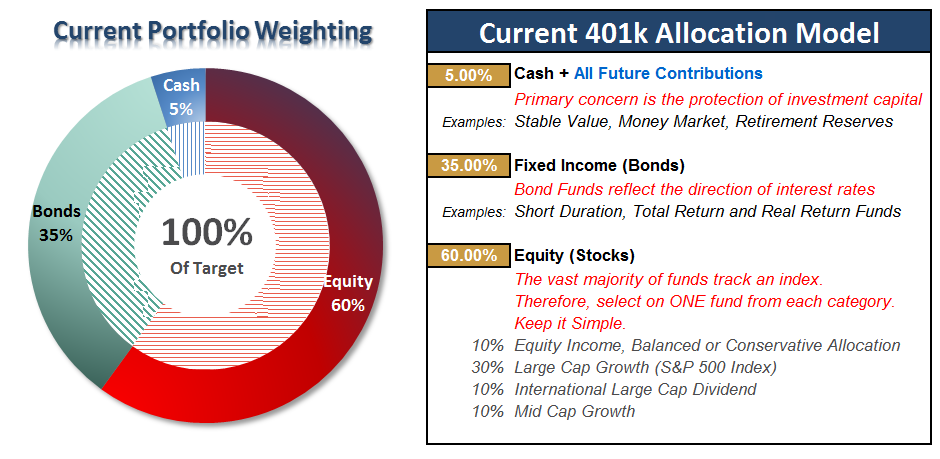
There are 4-steps to allocation changes based on 25% reduction increments. As noted in the chart above a 100% allocation level is equal to 60% stocks. I never advocate being 100% out of the market as it is far too difficult to reverse course when the market changes from a negative to a positive trend. Emotions keep us from taking the correct action.

Tax Reform Pushes Markets To Unseen Levels
As stated last week:
“The surge last week keeps the ‘bulls in the driver’s seat’ which keeps portfolio allocations at target levels for now.”
Such remains the case this week, but as noted in the 401k allocation chart above, we are now at the top of the long-term bullish trend channel. As noted by the arrows, with the markets extremely overbought and extended, it suggests there is little upside from here.
Importantly, note the orange horizontal lines I have added in the two bottom buy/sell signal indicators. The market has never been this overbought since I began tracking our model in 2006.(Just for the record, it hasn’t been this overbought since the turn of the century when I began running this model in the newsletter.)
This analysis remains consistent with an early-2018 tax selling correction in January. Such a correction would likely be confined to a pullback to the 200-dma, but could evolve into something larger depending on other macro-conditions.
Given the inability to hedge 401k-plans, I continue to recommended rebalancing risks in portfolios by trimming overweight equity exposure but adding to fixed income exposure.
Such actions will likely provide dividends as we move into the next couple of weeks as well as mutual funds ramp up capital gains distributions for the year. A pick up in volatility into the end of the year would not be surprising.
All NEW contributions to plans should currently be adjusted to cash or cash equivalents like a stable value fund, short-duration bond fund or retirement reserves. We will use these funds opportunistically to add to weightings when corrections occur.
If you need help after reading the alert; don’t hesitate to contact me.
Current 401-k Allocation Model
The 401k plan allocation plan below follows the K.I.S.S. principle. By keeping the allocation extremely simplified it allows for better control of the allocation and a closer tracking to the benchmark objective over time. (If you want to make it more complicated you can, however, statistics show that simply adding more funds does not increase performance to any great degree.)
401k Choice Matching List
The list below shows sample 401k plan funds for each major category. In reality, the majority of funds all track their indices fairly closely. Therefore, if you don’t see your exact fund listed, look for a fund that is similar in nature.

Disclosure: The information contained in this article should not be construed as financial or investment advice on any subject matter. Streettalk Advisors, LLC expressly disclaims all liability in ...
more

