
Above The 40 – The S&P 500 Marches Confidently Toward The Next Rate Hike
In reaction to U.S. Federal Reserve Chair Janet Yellen’s speech at The Executives’ Club of Chicago, the market pushed the 30-day Fed Future Funds to price in a 79.5% chance of a rate hike in March. These odds are up from 77.5% the previous day. Given the odds were already so high, the more important headline is that the odds did not decrease; Yellen did nothing to dissuade the market from its preparation for a March rate hike. Still, there was a bit of a sell on the news reaction in currency markets that sent the U.S. dollar index (DXY0) down sharply on the day. The reversal was sharp enough to plunge the dollar back to its support at its 50-day moving average (DMA) and thus start an early challenge to my assertion that the dollar will rally into the Fed’s March meeting.
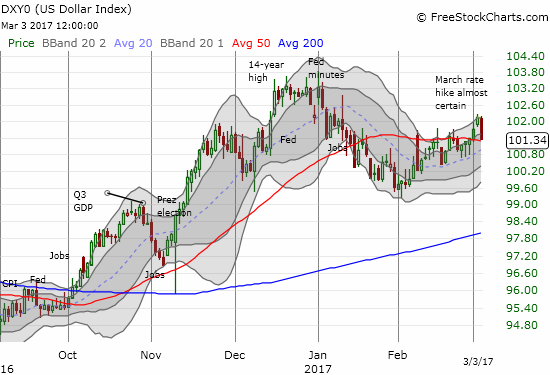
The U.S. dollar index plunged right back to support at its 50DMA
As I saw the “sell the news” reaction unfold, I quickly made an adjustment to my gold vs bonds pairs trade. I sold my put options on iShares 20+ Year Treasury Bond (TLT) and applied the profits to loading up on more SPDR Gold Shares (GLD) call options. I stand prepared to short TLT again IF it hits the top of its current range or breaks to a new low. The current technicals favor another run at 200DMA resistance for GLD as buyers stepped in at support from February’s mid-month congestion. Moreover, the 50DMA is rushing upward along with an uptrending 20DMA.
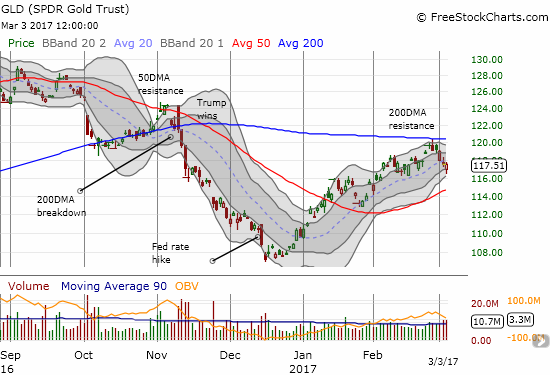
The SPDR Gold Shares rallied intraday to close the day near flatline. Momentum may be swinging back to the buyers.
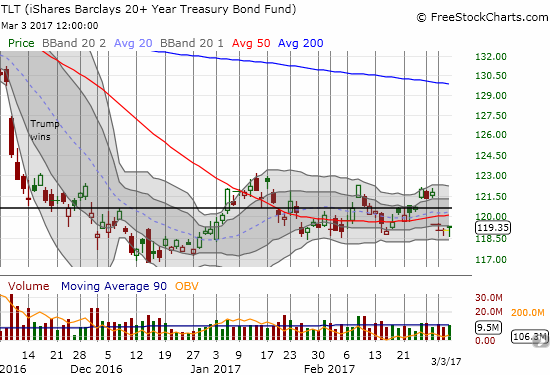
The iShares 20+ Year Treasury Bond (TLT) found firm support at the bottom of its current trading range. Yet, TLT remains below its 50DMA.
I may also need to rethink my new assumption that volatility will trend upward into the Fed’s March meeting. The volatility index, the VIX, took a major beating as Yellen’s words seemingly soothed whatever frayed nerves are still out there. The VIX dropped back to 11 and reaffirmed that the market remains in a period of extremely low volatility. As I demonstrated earlier, this extreme is NOT bearish, it is, surprisingly enough, bullish for the time-being. The S&P 500 is back to marching confidently toward the Federal Reserve’s next rate hike.
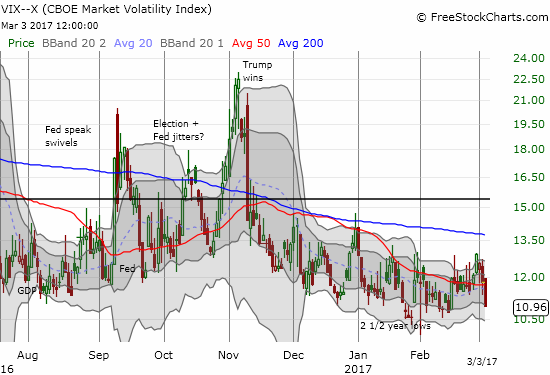
The volatility index, the VIX, plunged 7.2% in the wake of Yellen’s implicit affirmation of a March rate hike.
The S&P 500 (SPY) stumbled out the gate in a move that seemed to confirm the weakness from Thursday. I even braced for a bearish reversal of Wednesday’s gap up and breakout. The concern was short-lived as the index gently tapped its first upper-Bollinger Band (BB) and bounced from there. The index now looks ready to resume its rally. In parallel, AT40 (T2108), the percentage of stocks trading above their respective 40DMAs, marched back the bears from a three-week low to close with a minimal loss. The renewed sag in AT40 relative to the S&P 500 has my alarms tingling but not enough to flip the trading call off its neutral perch. My main bearish threshold sticks with a complete reversal of the S&P 500’s last breakout.
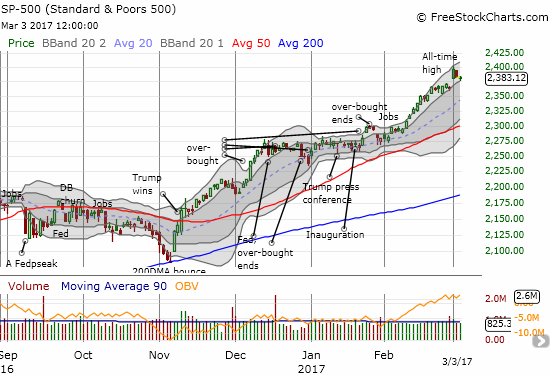
The S&P 500 (SPY) barely preserved its latest breakout.
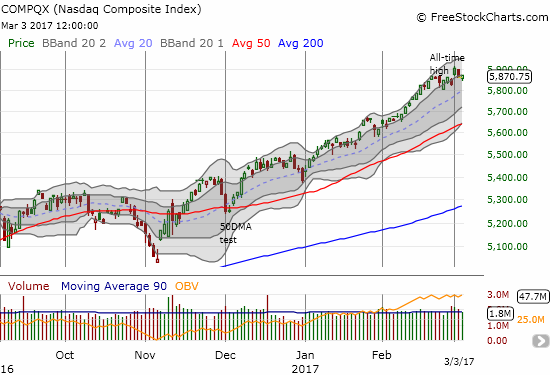
The NASDAQ (QQQ) essentially reversed its latest breakout, but the tech-laden index sits comfortably within a strong uptrend.
Apple (AAPL) is one of the major stocks underwriting the current rally. The stock freshly broke out this past week along with the major indices. AAPL also looks ready to lead the next charge higher. I am back to trading AAPL, and it is all from the long side. I hope to reintroduce the formal Apple Trade Model (ATM) soon. For now, I am keeping it simple: follow the trend and make sure to have a position in play going into Monday.
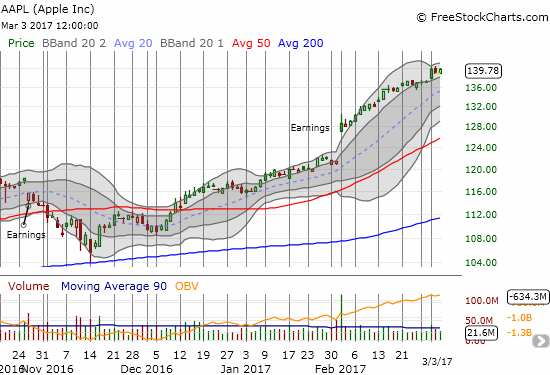
Apple is reaching for the skies…
The market is on day two of trading Snap, Inc. (SNAP) and the fireworks are as fresh as day one. I explained in the last “Above 40” my fundamental and technical reasons for SNAP bearishness. I knew I was in trouble when I saw the pre-market quote with SNAP regaining almost everything it lost from Thursday’s high. Sure enough, SNAP quickly soared from there to a $29.44 intraday high.
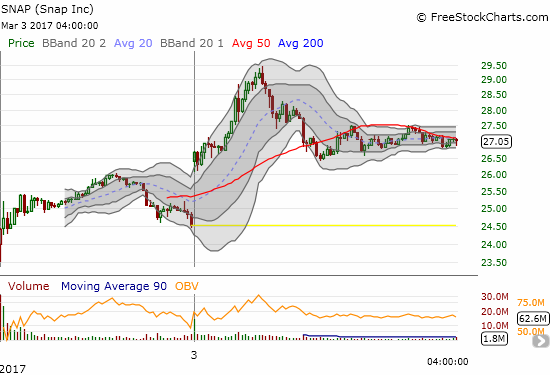
This 5-minute charts details the Snap, Inc. (SNAP) roller coaster.
The rule on IPO trading says to buy breakouts to new all-time highs. I failed to execute because I was more interested in looking for signs of a blow-off top. I finally absorbed what was happening during the 5 minute surge to $28.40. I resolved to buy the dip after this run-up. By the lunch hour, SNAP had nearly reversed its entire post-open run-up. I loaded up on shares here and quickly flipped the stock on the next push upward. I kept my original short position intact.
While these kinds of fast moves higher followed by rushes to sell are bound to exhaust buyers at some point, the rushes are good for sentiment. I see plenty of signs of reckless abandon which will tend to develop floors for the stock which I hope to use for quick intraday flips. Accordingly, traders on StockTwits have flipped back to bullish on SNAP.
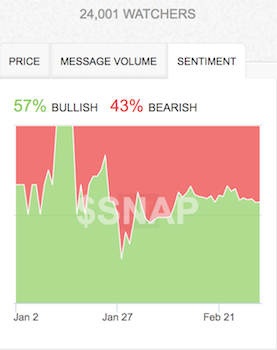
Source: StockTwits
Sentiment may be firming for SNAP as traders flip back to bullish tidings.
I shorted SNAP with an acceptable risk tolerance to around $30. Friday’s trading warned me that buyers are enthusiastic enough to take out that level. In the short-term, there is no point in adding to my small short position until/unless SNAP makes a new low (below $24). In the meantime, I will be looking for flipping opportunities like the ones created on Friday.
“Above the 40” uses the percentage of stocks trading above their respective 40-day moving averages (DMAs) to assess the technical health of the stock market and to identify extremes in market sentiment that are likely to reverse. Abbreviated as AT40, Above the 40 is an alternative label for “T2108” which was created by Worden. Learn more about T2108 on my T2108 Resource Page. AT200, or T2107, measures the percentage of stocks trading above their respective 200DMAs.
Active AT40 (T2108) periods: Day #261 over 20%, Day #81 over 30%, Day #80 over 40%, Day #78 over 50% (overperiod), Day #2 under 60% (underperiod), Day #27 under 70%
Daily AT40 (T2108)

Black line: AT40 (T2108) (% measured on the right)
Red line: Overbought threshold (70%); Blue line: Oversold threshold (20%)
Weekly AT40 (T2108)

All charts created using freestockcharts.com unless otherwise stated
The charts above are my LATEST updates independent of the date of this given AT40 post. For my latest AT40 post click here.
Related links:
The T2108 Resource Page
You can follow real-time T2108 commentary on twitter using the #T2108 or #AT40 hashtags. T2108-related trades and other trades are occasionally posted on twitter usingthe #120trade hashtag.
AT40 = 57.7% of stocks are trading above their respective 40-day moving averages (DMAs)
AT200 = 67.0% of stocks are trading above their respective 200DMAs
VIX = 11.0 (volatility index)
Short-term Trading Call: neutral
Commentary
So March it is then!
Full disclosure:long UVXY call options, long and short positions on the U.S. dollar, ...
more


Thanks for sharing