Another Solid GDP Report
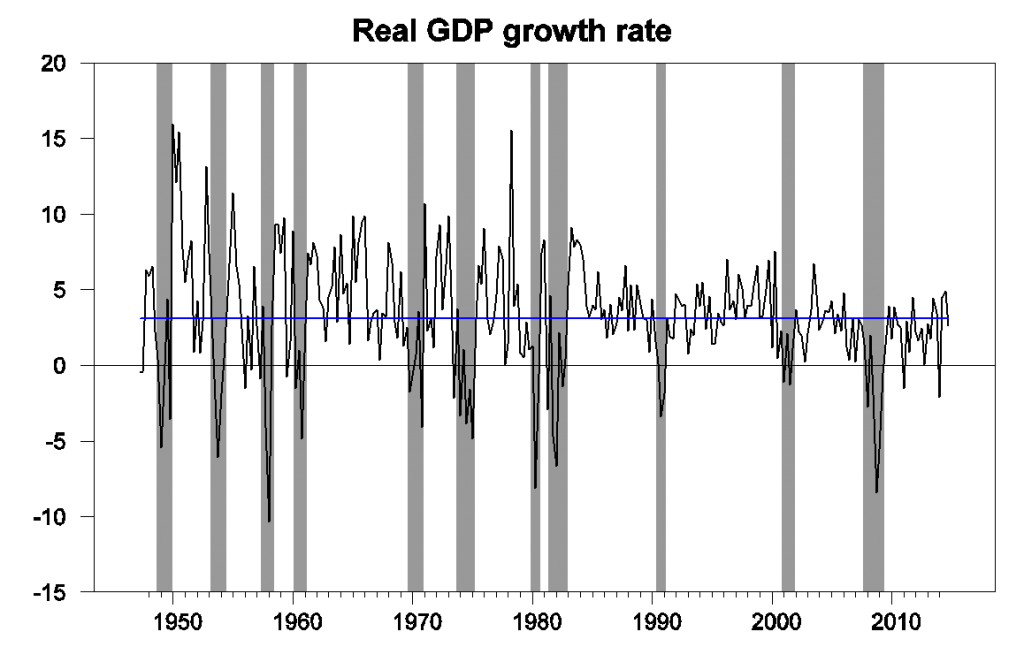
The Bureau of Economic Analysis announced yesterday that U.S. real GDP grew at a 2.6% annual rate in the third quarter. Even factoring in the dismal start to the year, that leaves full-year GDP growth during 2014 at 2.4% (the best annual performance since 2010) and growth at an annual rate of 4% over the last 9 months.

U.S. real GDP growth at an annual rate, 1947:Q2 - 2014:Q4. Blue horizontal line is drawn at the historical average (3.1%).
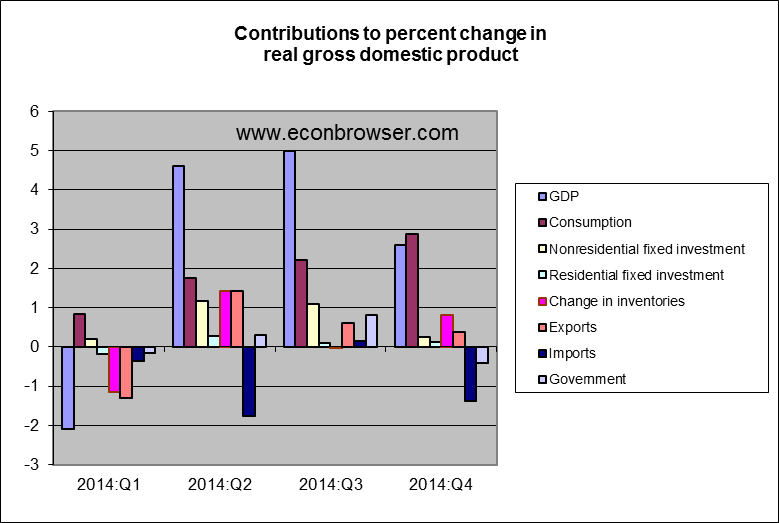
Government spending had contributed 0.8 percentage points to the Q3 growth but subtracted 0.4 percentage points from Q4. Most of that swing can be attributed to a one-time bulge in defense spending in Q3. But the biggest reason for slower GDP growth in Q4 than in Q3 was the fact that real imports grew by 8.5% (at a continuously compounded rate) in the fourth quarter. Since imports are subtracted from GDP, more imports mean less GDP.

It’s worth noting that although real imports increased by 8.5% at an annual rate, the nominal value (that is, the actual number of dollars spent on imports) was only up 0.9% at an annual rate. The big story was not simply that we’re importing more barrels of oil than expected for this time of year, but that each barrel of imported oil cost us fewer dollars. That means that the apparent surge in real imports is less of a long-run burden for the U.S. than might appear at first glance from the data, and the underlying situation is reasonably healthy.
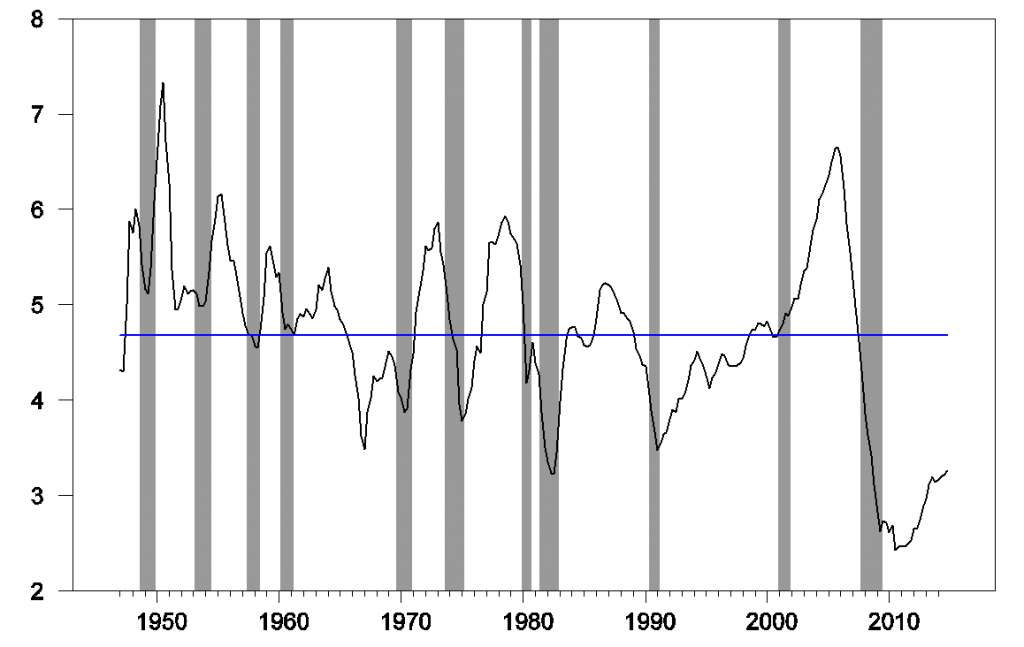
Fixed investment remains disappointing. But as Bill McBride notes, there’s still lots of room for growth there and reasonable basis for expecting it’s still to come. Residential fixed investment is still way below normal when expressed as a percentage of GDP– added confirmation of Reinhart and Rogoff’s observation that recovery from an event like the U.S. has gone through takes a long time. Once housing makes a decent recovery, we might expect business plant and equipment and structures to follow.

Residential fixed investment as a percentage of GDP. Blue horizontal line is drawn at the historical average (4.68%).
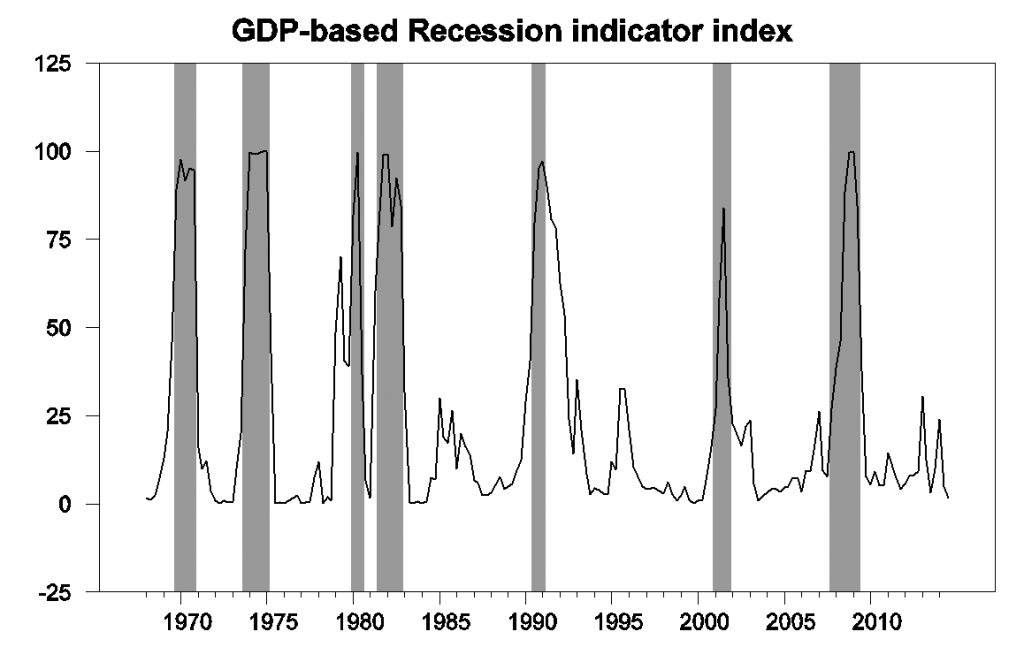
Our Econbrowser Recession Indicator Index, which uses yesterday’s data release to form a picture of where the economy stood as of the end of 2014:Q3, is now all the way down to 1.6%, an unambiguous signal of an ongoing recovery.

GDP-based recession indicator index: The plotted value for each date is based solely on information as it would have been publicly available and reported as of one quarter after the indicated date, with 2014:Q3 the last date shown on the graph. Shaded regions represent the NBER’s dates for recessions, which dates were not used in any way in constructing the index, and which were sometimes not reported until two years after the date.
All of which is keeping our Little Econ Watcher happy.
![]()
Disclosure: None.


