
Above The 40 – An Apple Breakdown Nudges Stock Market Toward Oversold
AT40 = 29.6% of stocks are trading above their respective 40-day moving averages (DMAs)
AT200 = 30.0% of stocks are trading above their respective 200DMAs
VIX = 21.3
Short-term Trading Call: neutral
Commentary
The technical damage in the stock market continues to spread as the countdown to “hedge fund d-day” nears an end.
AT40 (T2108), the percentage of stocks trading above their respective 40DMAs, sank for the fourth of the last five trading days. My favorite technical indicator closed just below 30% in what looks like a tentative approach toward oversold trading conditions. AT200 (T2107), the percentage of stocks trading above their respective 200DMAs, closed right at 30.0% and looks ready to return to the lows of the last oversold period.
The declines of the breadth indicators are so ominous because the major indices suffered major 200DMA breakdowns and confirmed them with follow-on selling. The S&P 500 (SPY) lost another 0.8% and closed at its 4th lowest point since the selling began in October. The index last traded at this point on October 31st when the stock market was just beginning to lift off the lows of the last oversold period. At that time, AT40 sat all the way down at 16.1%. So the “good news” is that the selling this time around is much more concentrated (see the chart of Apple below).
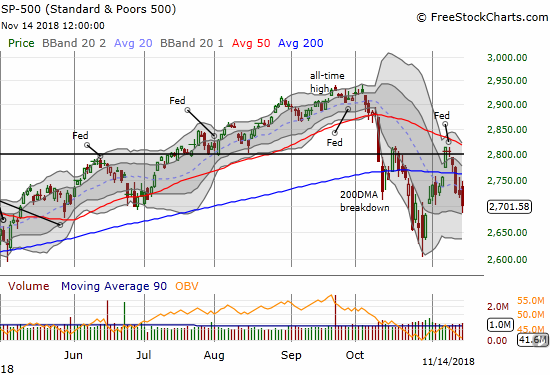
The S&P 500 (SPY) dropped further confirmed its 200DMA breakdown with a 0.8% loss.
The NASDAQ and the Invesco QQQ Trust (QQQ) ominously closed at their SECOND lowest point since the selling began in October. It seems a retest of the recent lows is right around the corner. The market REALLY needs a higher low here!
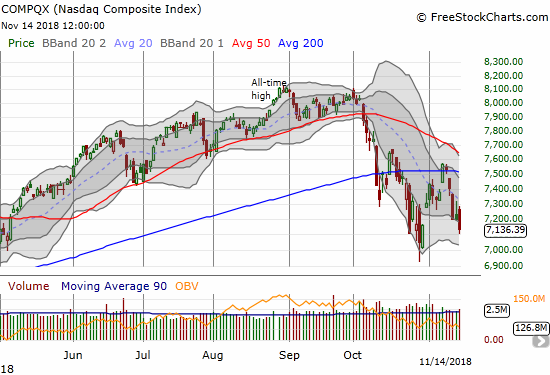
The NASDAQ lost another 0.9% on its way to what looks like a test of the October lows.
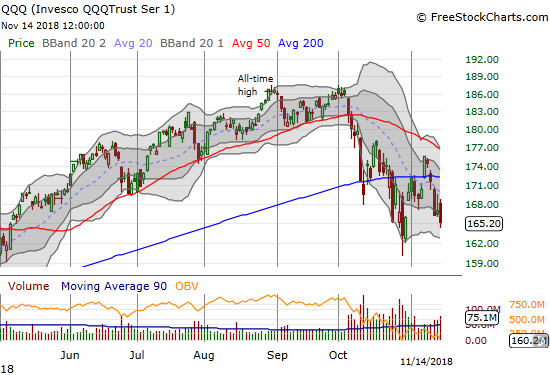
The Invesco QQQ Trust (QQQ) lost another 0.8% and further confirmed its 200DMA breakdown. Next up, the October lows?
Small-caps in the form of iShares Russell 2000 ETF (IWM) never even came close to breaking out above 200DMA resistance. Based on October’s volatility, IWM is just another trading day away from retesting the recent lows. This trading action has disappointed me the most as it positions IWM very bearishly and invalidated one of my key trades coming out of the last oversold period.
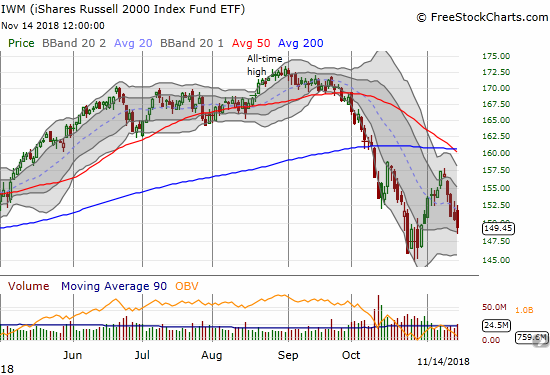
The iShares Russell 2000 ETF (IWM) lost another 0.7%. Like its tech-laden counterparts, IWM looks ready to test recent lows any day now.
The Financial Select Sector SPDR ETF (XLF) confirmed 50DMA resistance on Monday and followed through today with a 1.4% loss. Yet, XLF does not look quite ready to test recent lows. So on a relative basis, XLF finally looks “better” than the major indices.
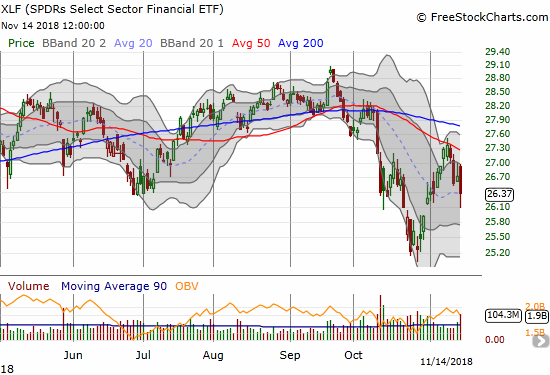
The Financial Select Sector SPDR ETF (XLF) closed at its 20DMA support on its 3rd losing day of the last 4 trading days.
The volatility index, the VIX, pushed further into “elevated” territory with a close at 21.3.
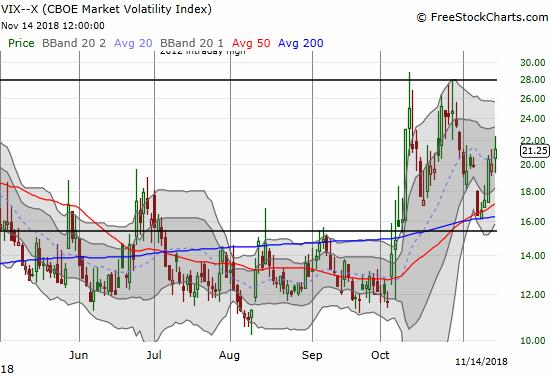
The volatility index, the VIX, is ominously regaining upward momentum.
Overall, the bears maintained their fresh grip on the market. Even the intraday action allowed the sellers to show off. After gapping higher at the open, the S&P 500 quickly closed the gap on its way to almost 5 hours of persistent selling. The bounce from the intraday low was met by heavy selling in the last 45 minutes or so of trading. With the VIX cruising beyond 20, AT40 in the 20s, and QQQ and IWM a trading day away from testing the October lows, a third trip to oversold territory seems like a near guarantee. Since AT40 is lagging the selling this time around, oversold trading conditions will likely only come on a BREAK of the October lows. I bought QQQ puts on the day as an additional precaution.
CHART REVIEWS
Apple (AAPL)
AAPL is the lead weight helping to drive the market lower and lower; perhaps the now hapless stock is a prime “source of funds” for hedge fund redemptions. Fortunes have certainly flipped for AAPL. In October, it was a bastion of safety from the selling. In November, it is leading the selling by a country mile. I assume AAPL’s crushing 14.6% loss in November is the prime driver sending the indices lower at a faster pace than the breadth indices. AAPL is now at 4-month lows, and today’s 2.8% loss bearishly confirmed AAPL’s 200DMA breakdown.
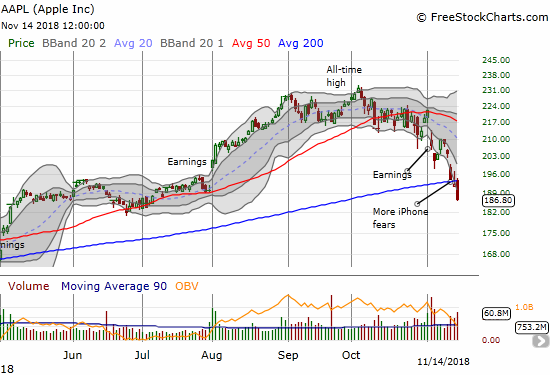
Apple (AAPL) lost another 2.8% as it confirmed a bearish 200DMA breakdown.
Advanced Micro Devices (AMD)
AMD bucked the selling trend with a nice pop. A close above the previous peak would set it up for a quick test of declining 50DMA resistance.
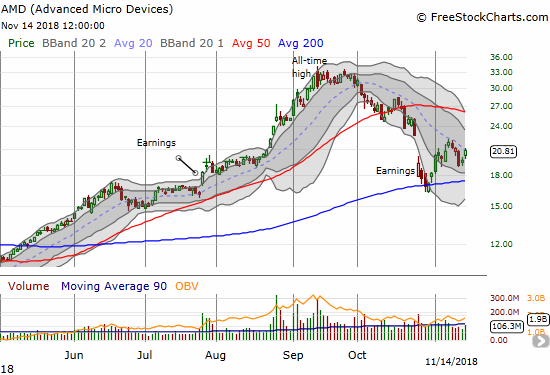
Advanced Micro Devices (AMD) greatly out-performed the market with a 6.1% bounce that took the stock right back to its downtrending 20DMA.
Caterpillar (CAT)
CAT continues to cling to its declining 20DMA support. I do not think this support will last much longer. Accordingly, I added to my put options as a bigger hedge for my flagging bullish positions.
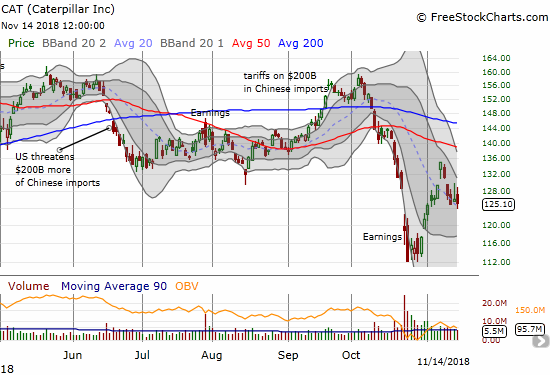
Caterpillar (CAT) lost 0.7% as it tries to cling to the $125 level with a downsloping 20DMA as support.
Macys (M)
Macys lost a whopping 7.2% post-earnings in a wild day of trading. The stock started with a nice surge off the open for the first 10 minutes. The stock was almost all downhill from there. The stock sliced through 50 and 200DMA supports in a move that looks like the resumption of the preceding downtrend that was well-defined by a declining 20DMA.
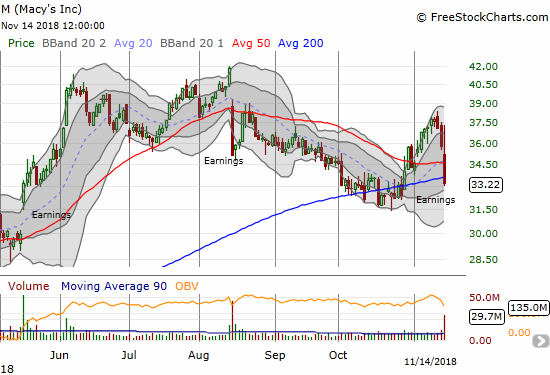
Macys (M) sold off for the second earnings a row. Something tells me it will not recover so quickly from THIS round.
PPG Industries, Inc. (PPG)
PPG helped kick off the ominous tone of October’s earnings season with a warning on intensifying inflation pressures and weakening demand. So it is VERY ironic that over a month later, PPG has already filled the related gap down. With 50 and 200DMA resistance stopping the advance, PPG looks bearish again. Yet, it is hard to ignore the bullish implications of its rapid recovery. I will more actively watch how this stock unfolds from here.
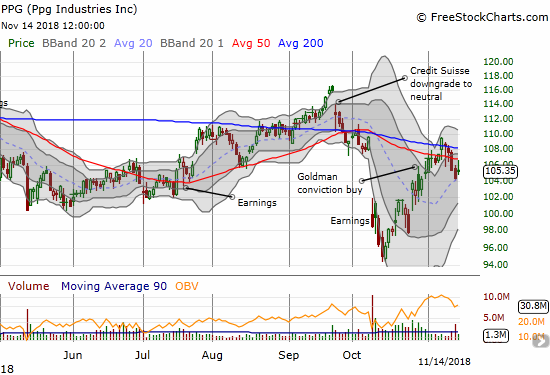
PPG Industries, Inc. (PPG) filled its post-earnings gap down, but 200DMA resistance sent the stock back down.
Whirlpool (WHR)
I expected WHR to succumb in the face of the kind of market selling that is happening now. Instead, the stock is actually holding onto its November gain even as it pivots around its declining 50DMA. The stock finally gave in a bit with today’s 2.6% loss. I find it hard to imagine WHR can resist the selling pressures for much longer given the stock’s connection to housing, cyclicals, retail, and global growth.
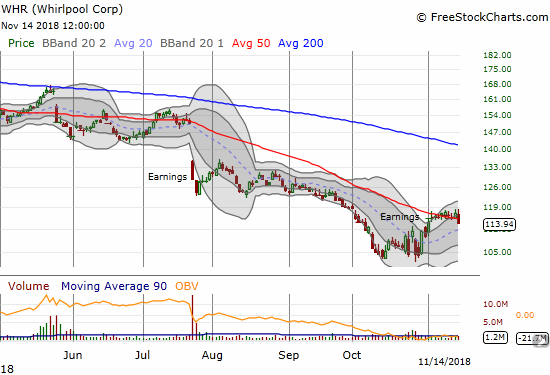
Whirlpool (WHR) is up for the month of November and has held pretty steady since the surge that began the month.
Bitcoin (BTC/USD)
Bitcoin finally cracked the $6000 level that served as support during months of churn that became so boring that even CNBC’s Fast Money even stopped trotting out guests to explain why the latest blip represented the best buying opportunity yet. It is now no longer possible to point out that Bitcoin is still higher than it was a year ago. I highly doubt the most fantastical year-end projections of 20K on up to 50K will happen.
On cue, Fast Money’s Brian Kelly explained why this plunge represents a great buying opportunity. Kelly also explained what drove the selling; at this point, I do not think the explanations matter much for the every day crypto speculator. The price action is still the end all be all. This kind of hard fork chaos is another weakness in crypto that needs resolution before it can serve as a viable currency.
Crypto melting down today and @BKBrianKelly takes to the charts to get to the root of what exactly happened. pic.twitter.com/O6bAZ0O4Nm
— CNBC's Fast Money (@CNBCFastMoney) November 14, 2018
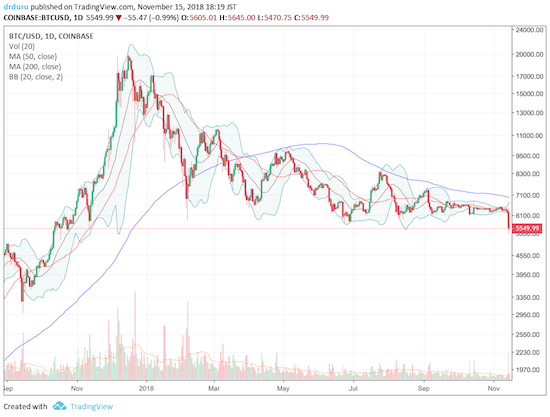
If Bitcoin were any other financial instrument, I would warn that a new plunge downward is underway. Instead, I will just note the dangers in trying to call a bottom ona new 52-week low following a long period of calm that undoubtedly lured in unsuspecting buyers.
Source: Trading View
Interestingly, Fast Money followed up with Meltem Demirors who explained why crypto is now in its own financial crisis…with Bitcoin looking like the stalwart among wannabes on their way to zero. Demirors’s reference to the dotcom bubble should be a crypto-classic. “I wasn’t there but…”
Crytpo's market crash could be the beginning of something bigger. @Melt_Dem says #crypto is in a financial crisis. pic.twitter.com/xBjikNwfth
— CNBC's Fast Money (@CNBCFastMoney) November 14, 2018
“Above the 40” uses the percentage of stocks trading above their respective 40-day moving averages (DMAs) to assess the technical health of the stock market and to identify extremes in market sentiment that are likely to reverse. Abbreviated as AT40, Above the 40 is an alternative label for “T2108” which was created by Worden. Learn more about T2108 on my T2108 Resource Page. AT200, or T2107, measures the percentage of stocks trading above their respective 200DMAs.
Active AT40 (T2108) periods: Day #10 over 20% (overperiod), Day #1 under 30% (underperiod ending 6 days over 30%), Day #4 under 40%, Day #38 under 50%, Day #54 under 60%, Day #107 under 70%
Daily AT40 (T2108)

Black line: AT40 (T2108) (% measured on the right)
Red line: Overbought threshold (70%); Blue line: Oversold threshold (20%)
Weekly AT40 (T2108)

*All charts created using freestockcharts.com unless otherwise stated
*Charting notes: FreeStockCharts.com stock prices are not adjusted for dividends. TradingView.com charts for currencies use Tokyo time as the start of the forex trading day. FreeStockCharts.com currency charts are based on Eastern U.S. time to define the trading day.
Full disclosure: long SSO, long AAPL calls, long CAT puts, long QQQ puts, long UVXY puts, long WHR puts, others mentioned above
Follow Dr. Duru’s commentary on financial markets via more


