A Surprise Shift In U.S. Soybean Exports
When we last considered the state of trade between the U.S. and China, we anticipated that we would see the year over year growth rate of exchange rate-adjusted value of the goods and services transacted between the two nations pick up in June 2018, as international shippers strove to beat the clock for when a new round of tariffs imposed by both nation's on each others goods went into effect in early July 2018.
Sure enough, there was indeed a small pickup in those growth rates, with U.S. exports to China accelerating to a positive value, ahead of a smaller increase in the growth rate of China's exports to the United States.

One of the things that we were primed to expect from mainstream news coverage is that shippers were rushing to get U.S. soybeans to China before the tariff clock finished counting down.
A ship carrying U.S. soybeans is steaming toward northern China in a race to beat a 25 percent tariff.
Peak Pegasus is expected to arrive in Dalian on Friday, the same day that China is scheduled to impose tariffs on imports from the U.S., according to shipping data compiled by Bloomberg and a person familiar with the matter. If it arrives as scheduled, it should be able to clear customs before the tariffs are imposed, according to the person, who asked not to be identified because they’re not authorized to speak to the media. Ship-tracking data currently shows it arriving at about 5 p.m. local time.
The Peak Pegasus would likely have been the last cargo ship to try to successfully beat China's tariff clock, but it would have been far from the only ship doing so, where others would already have completed their cargo runs during the month of June 2018. Since we've been tracking what had been a U.S. trade success story with respect to China's importation of U.S. soybeans for years, we were set up to capture the impact that this kind of tariff-avoidance activity would have.
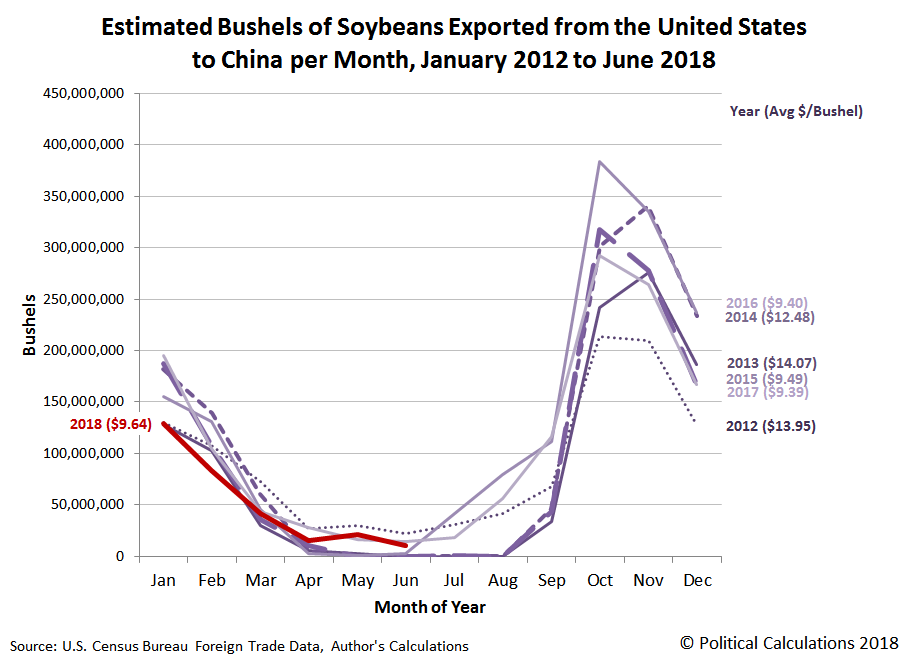
What we found was... nothing that stood out in any meaningful way from the seasonal pattern for U.S. soybean exports to China for every June since 2012.

If anything, the level of U.S. soybean exports to China during the year-to-date of 2018 is consistent with what we saw in the first half of 2017.
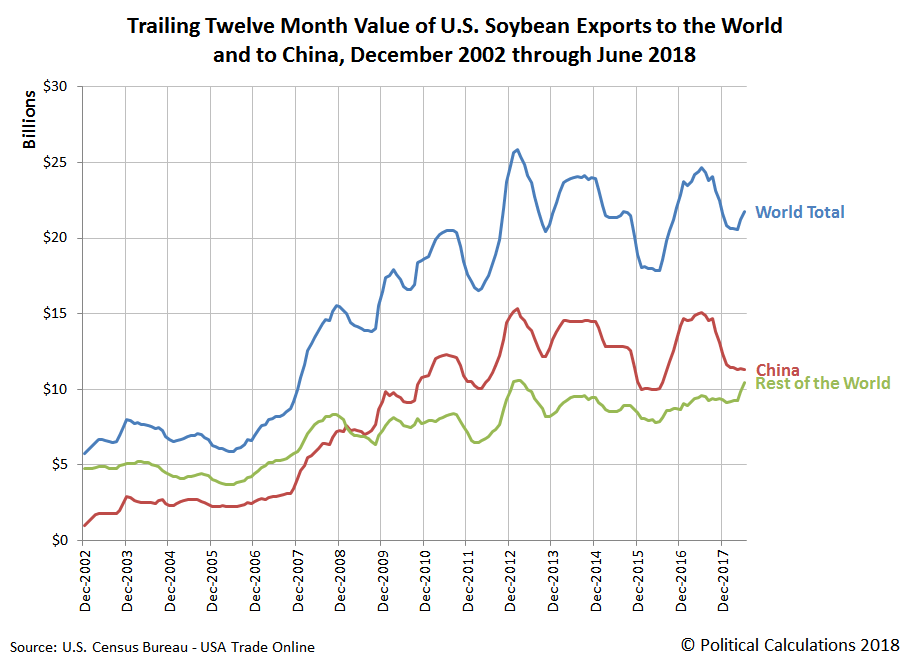
So we took a step back and considered the state of all of the United States' soybean exports to the world. The following chart shows the trailing twelve month value of those exports from December 2002 through June 2018, where we've broken out the figures for those that have gone to China and those that have gone to the "Rest of the World".

By tracking the trailing twelve month value of U.S. soybean exports, we're able to minimize the impact of annual seasonal variation in the data, which allows us to more easily pick up on changing trends. As you can see in this chart, the level of soybean exports to China really isn't doing anything much out of the ordinary for the last six years, but something unusual is happeneing with U.S. soybean exports to the rest of the world. During the last two months for which we have data, they have picked up considerably.
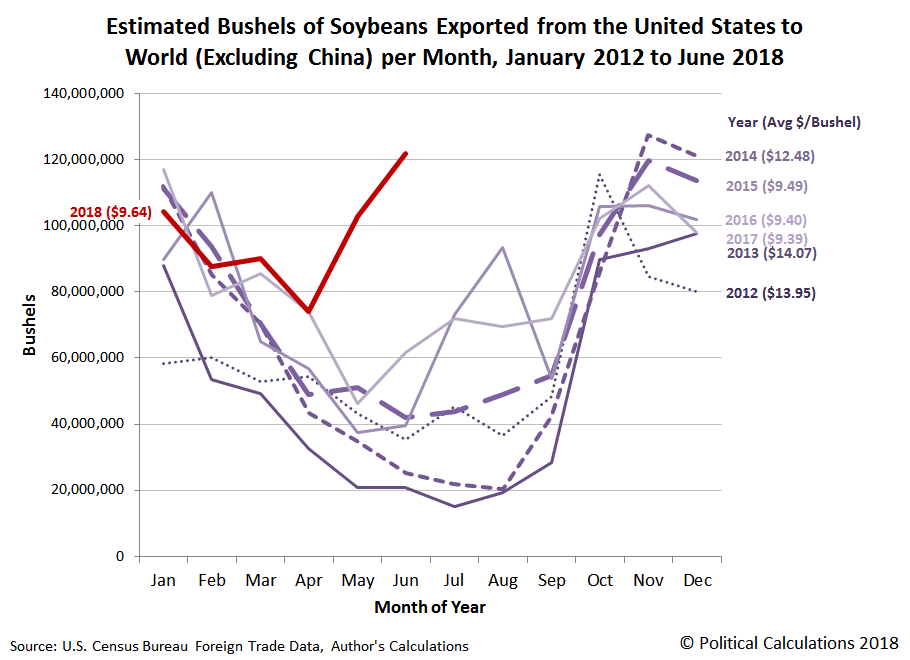
The next chart visualizes our estimate of the number of bushels of U.S. soybean exports being delivered to the world, excluding China, where we find a remarkable shift in the seasonal pattern.

Somebody in the world has decided to step up their importation of mass quantities of U.S. soybeans, and after a little digging in the U.S. Census Bureau's international trade database, we found that Egypt, Mexico, Pakistan, and the Netherlands were the leaders in that remarkable year over year growth for what is typically the slowest time of the year for U.S. soybean exports.
This change is likely being driven by China's decision to buy up as many soybeans as they can from Brazil and from Argentina, which are just past their Southern Hemisphere harvest, where soybean prices in those nations have spiked in response to China's increase in demand, at the expense of U.S. soybeans, whose price had been falling until recently.
That combination of price changes driven by China's new soybean sourcing strategy has shifted the direction of U.S. soybean exports. And is doing so well ahead of when U.S. soybean farmers will begin harvesting their crops in September, which is traditionally when U.S. soybean exports to China begin rising to their annual peak values through the end of the year.
All in all, a pretty remarkable and surprising shift in U.S. soybean exports!
References
Board of Governors of the Federal Reserve System. China / U.S. Foreign Exchange Rate. G.5 Foreign Exchange Rates. Accessed 3 August 2018.
U.S. Census Bureau. Trade in Goods with China. Accessed 3 August 2018.
Disclaimer: Materials that are published by Political Calculations can provide visitors with free information and insights regarding the incentives created by the laws and policies described. ...
more


